Configure VMWare ESXi Log Ingestion
This tutorial will show you how to onboard an ESXi host into Azure Sentinel via the Log Analytics Agent.
Pre-requisite
Log Analytics Agent
If you do not have one, you can follow these steps to create one:
Configure Azure log collector for syslog
You can follow the link “Collect Syslog data sources with Log Analytics agent” if you haven’t configured it yet.
Scope and Limitation
This tutorial is base on ESXi 7 and above
This tutorial would show you the basic setup but if you have a hardened syslog setup you may also need to set the other fields in your ESXi settings using the following keywords: “syslog.global”
You can refer to “Configure Syslog on ESXi Hosts” for more information
Onboarding your ESXi
You have to do this for each of your ESXi host
Login to you ESXi server
Go to “Host”
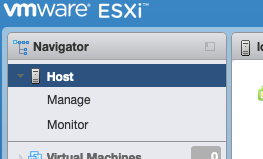
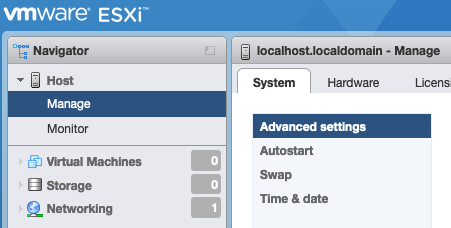
Go to “Manage”
Select “System” Tab
Select “Advance Settings”
Search for “syslog.global.logHost“
Click on edit option
Add in your log analytics agent setup details with the following details
udp or tcp
ip or hostname
port
example: udp://192.168.246.3:514
Click “Save”
You can verify if the setup is working by going to your Sentinel log query and see if your ESXi hostname is in there under the Computer fields
Syslog | distinct Computer
Note: If you have VSphere setup, you should be able to see all your ESXi host from there without logging in to each server one by one.
Troubleshooting
Make sure your Agent is listening to the port (Note: Depending on your setup, the sample below is listening to udp and tcp but normally syslog listens to udp only)
NONEnetstat -taupn | grep syslog tcp 0 0 0.0.0.0:514 0.0.0.0:* LISTEN 4483/rsyslogd udp 0 0 0.0.0.0:514 0.0.0.0:* LISTEN 4483/rsyslogdTest if the port is open (you can do this on both local and remote)
UDP: nc -z -v -u [ip address] [port]
TCP: nc -z -v [ip address] [port]
Succesful connection should look something like
CODEnc -z -v -u 127.0.0.1 514 localhost [127.0.0.1] 514 (syslog) open
Test if you can send a message (you can do this on both local and remote)
UDP: nc -w1 -u [ip address] [port] <<< "testUDP"
TCP: nc -w1 -u [ip address] [port] <<< "testTCP"
If everything is successful you should immediately see the Computer name: testUDP or testTCP in the Sentinel log or you can use this query:
Syslog | where Computer == "testUDP" or Computer == "testTCP"
Appendix
Enable SSH access on the ESXi host for troubleshooting connections
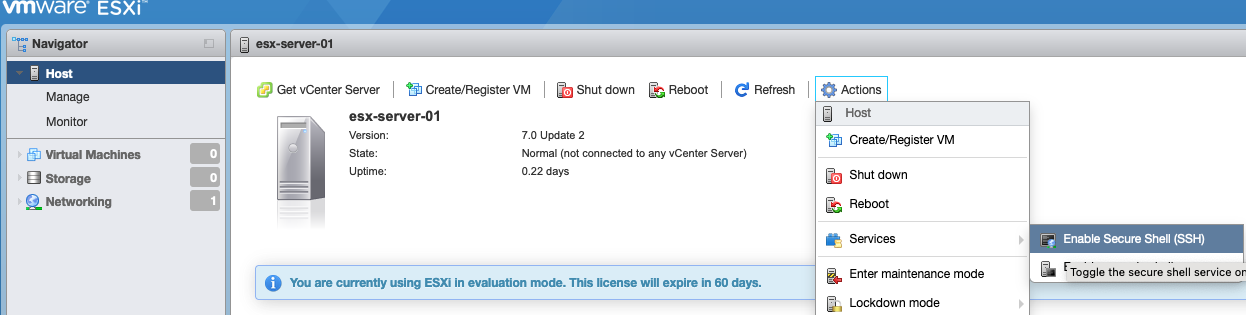
Login to ESXi server
Click the host
Click on Actions
Click on Services
Enable SSH