Incidents
Topics Discussed
Product Overview
The Incidents screen displays security incidents detected by the Armor correlation engine. For each incident, the associated events that caused the detection are also provided.
All security incidents start as a detection, before being escalated by Armor's Security Operations Center (SOC). These escalated incidents are important, and you should take steps immediately to mitigate the threat.
To fully use this screen, you must have the following permissions assigned to your account:
Read Security Offenses
Frequently Asked Questions
Can I close security incidents myself?
Only Armor Support can close a security incident. However, after you have performed the troubleshooting tips suggested by Armor Support, simply enter a comment expressing your desire to close the ticket. Armor Support will verify and confirm that the security incident has been properly addressed, and then they will close the ticket.
What happens if I don't see any data in the Incidents screen?
Consider these possibilities:
Your account does not have any security incidents to display.
Armor is responsible for adding security-related incidents to this screen.
You do not have permissions to view security incidents.
You must have the Read Security Alerts and Read Security Offenses permissions enabled to view security incidents in this screen. Contact your account administrator to enable this permission.
Nexus - Incidents
Incidents Screen
Access the Incidents Screen
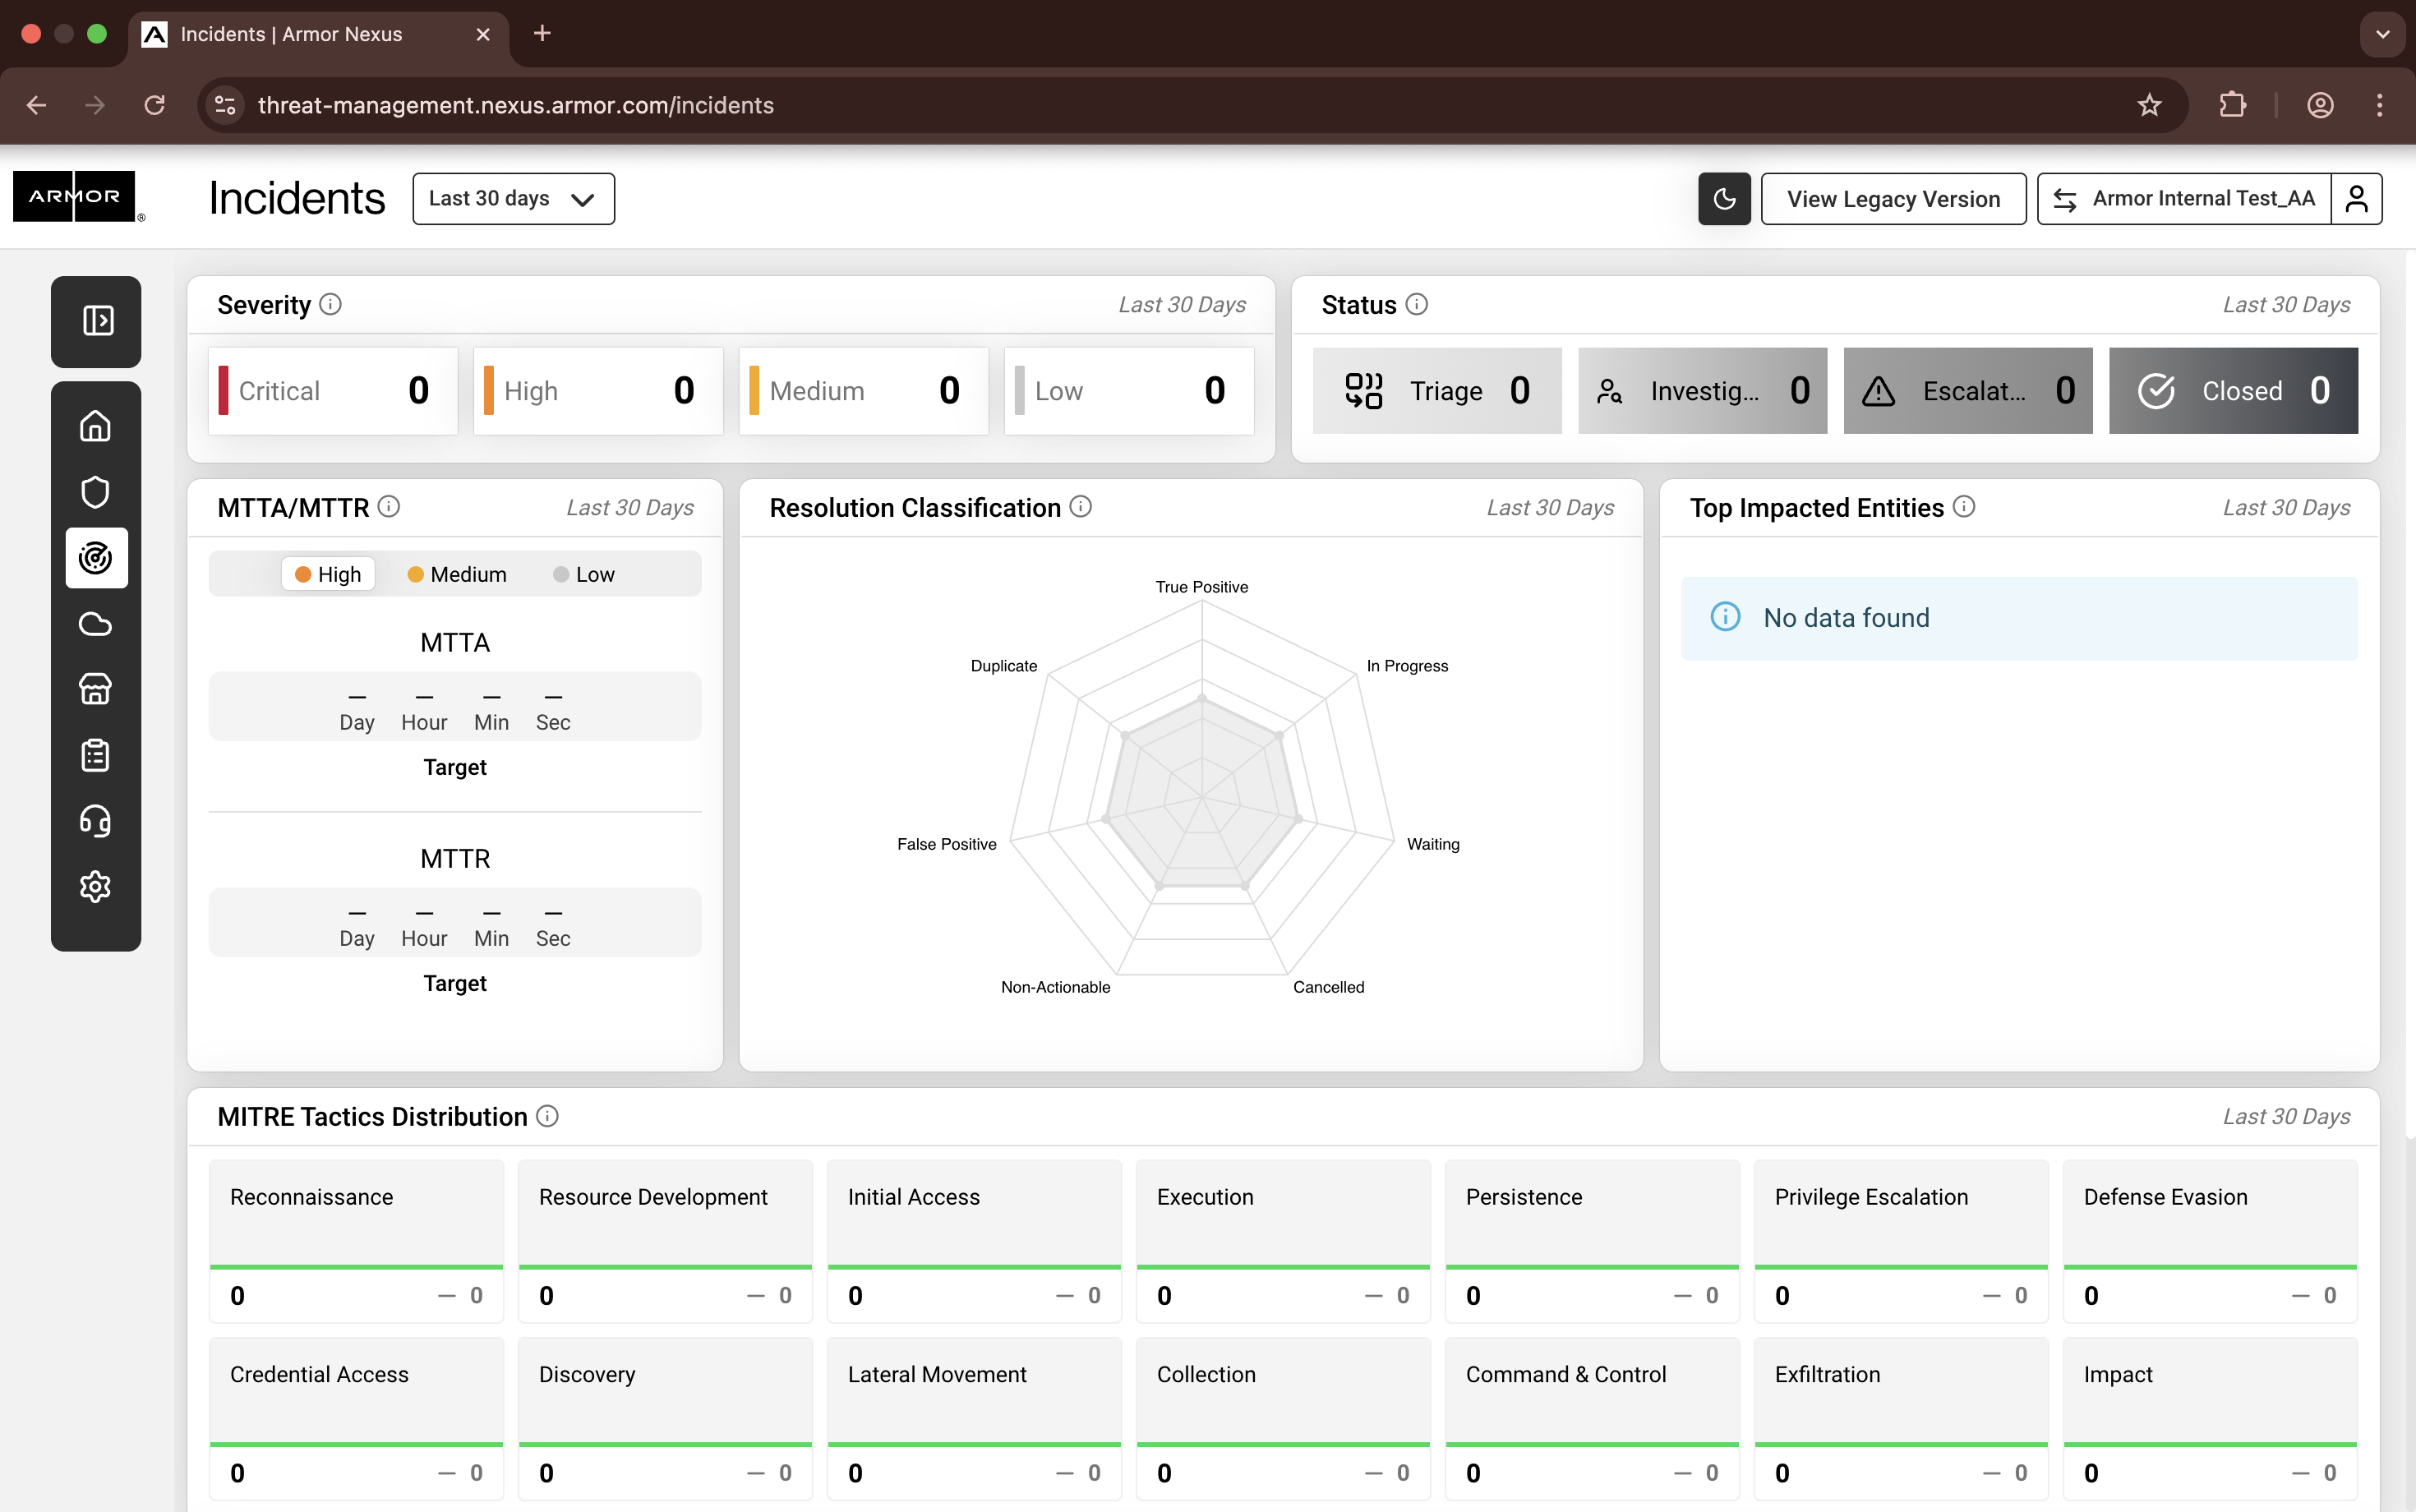
The Incidents Dashboard provides a centralized view of all security incidents detected and managed within the Armor Nexus platform. It helps security teams monitor incident trends, assess severity, and track resolution performance over time.
To access the Incidents screen:
In Nexus, hover over Threat Management

Then click Incidents
Nexus - Incidents Page
1. Time Range Selector
Located at the top-left.
Allows filtering data by predefined periods (e.g., Last 30 Days):
Last 30 days
Last 14 days
Last 7 days
2. Severity Summary
Displays the total number of incidents by severity:
Critical
High
Medium
Low
3. Status Summary
Shows incidents grouped by their current workflow status:
Triage
Investigating
Escalated
Closed
4. MTTA / MTTR
MTTA (Mean Time to Acknowledge): Average time to acknowledge an incident.
MTTR (Mean Time to Resolve): Average time to resolve an incident.
Metrics are broken down by severity (High, Medium, Low). You can click on each severity to see more details.
5. Resolution Classification
Radar chart categorizing incident outcomes:
True Positive
False Positive
Duplicate
Non-Actionable
Cancelled
In Progress
Work in Progress
6. Top Impacted Entities
Lists the most affected assets or entities based on incident data.
7. MITRE Tactics Distribution
Displays incidents mapped to MITRE ATT&CK tactics:
Reconnaissance
Initial Access
Execution
Persistence
Privilege Escalation
Defense Evasion
Credential Access
Lateral Movement
Collection
Command & Control
Exfiltration
Impact
8. Incident Table
Located at the bottom of the dashboard.
Provides a detailed list of incidents with the following columns:
ID: Unique identifier for the incident.
Organization: The organization associated with the incident.
Priority: Incident priority (e.g., Low, Medium, High).
Status: Current status (e.g., Waiting on Customer Approval).
Created: Date and time the incident was created.
Updated: Last update timestamp.
Includes a search bar and filters for:
Sort order
Organization
Status
Priority
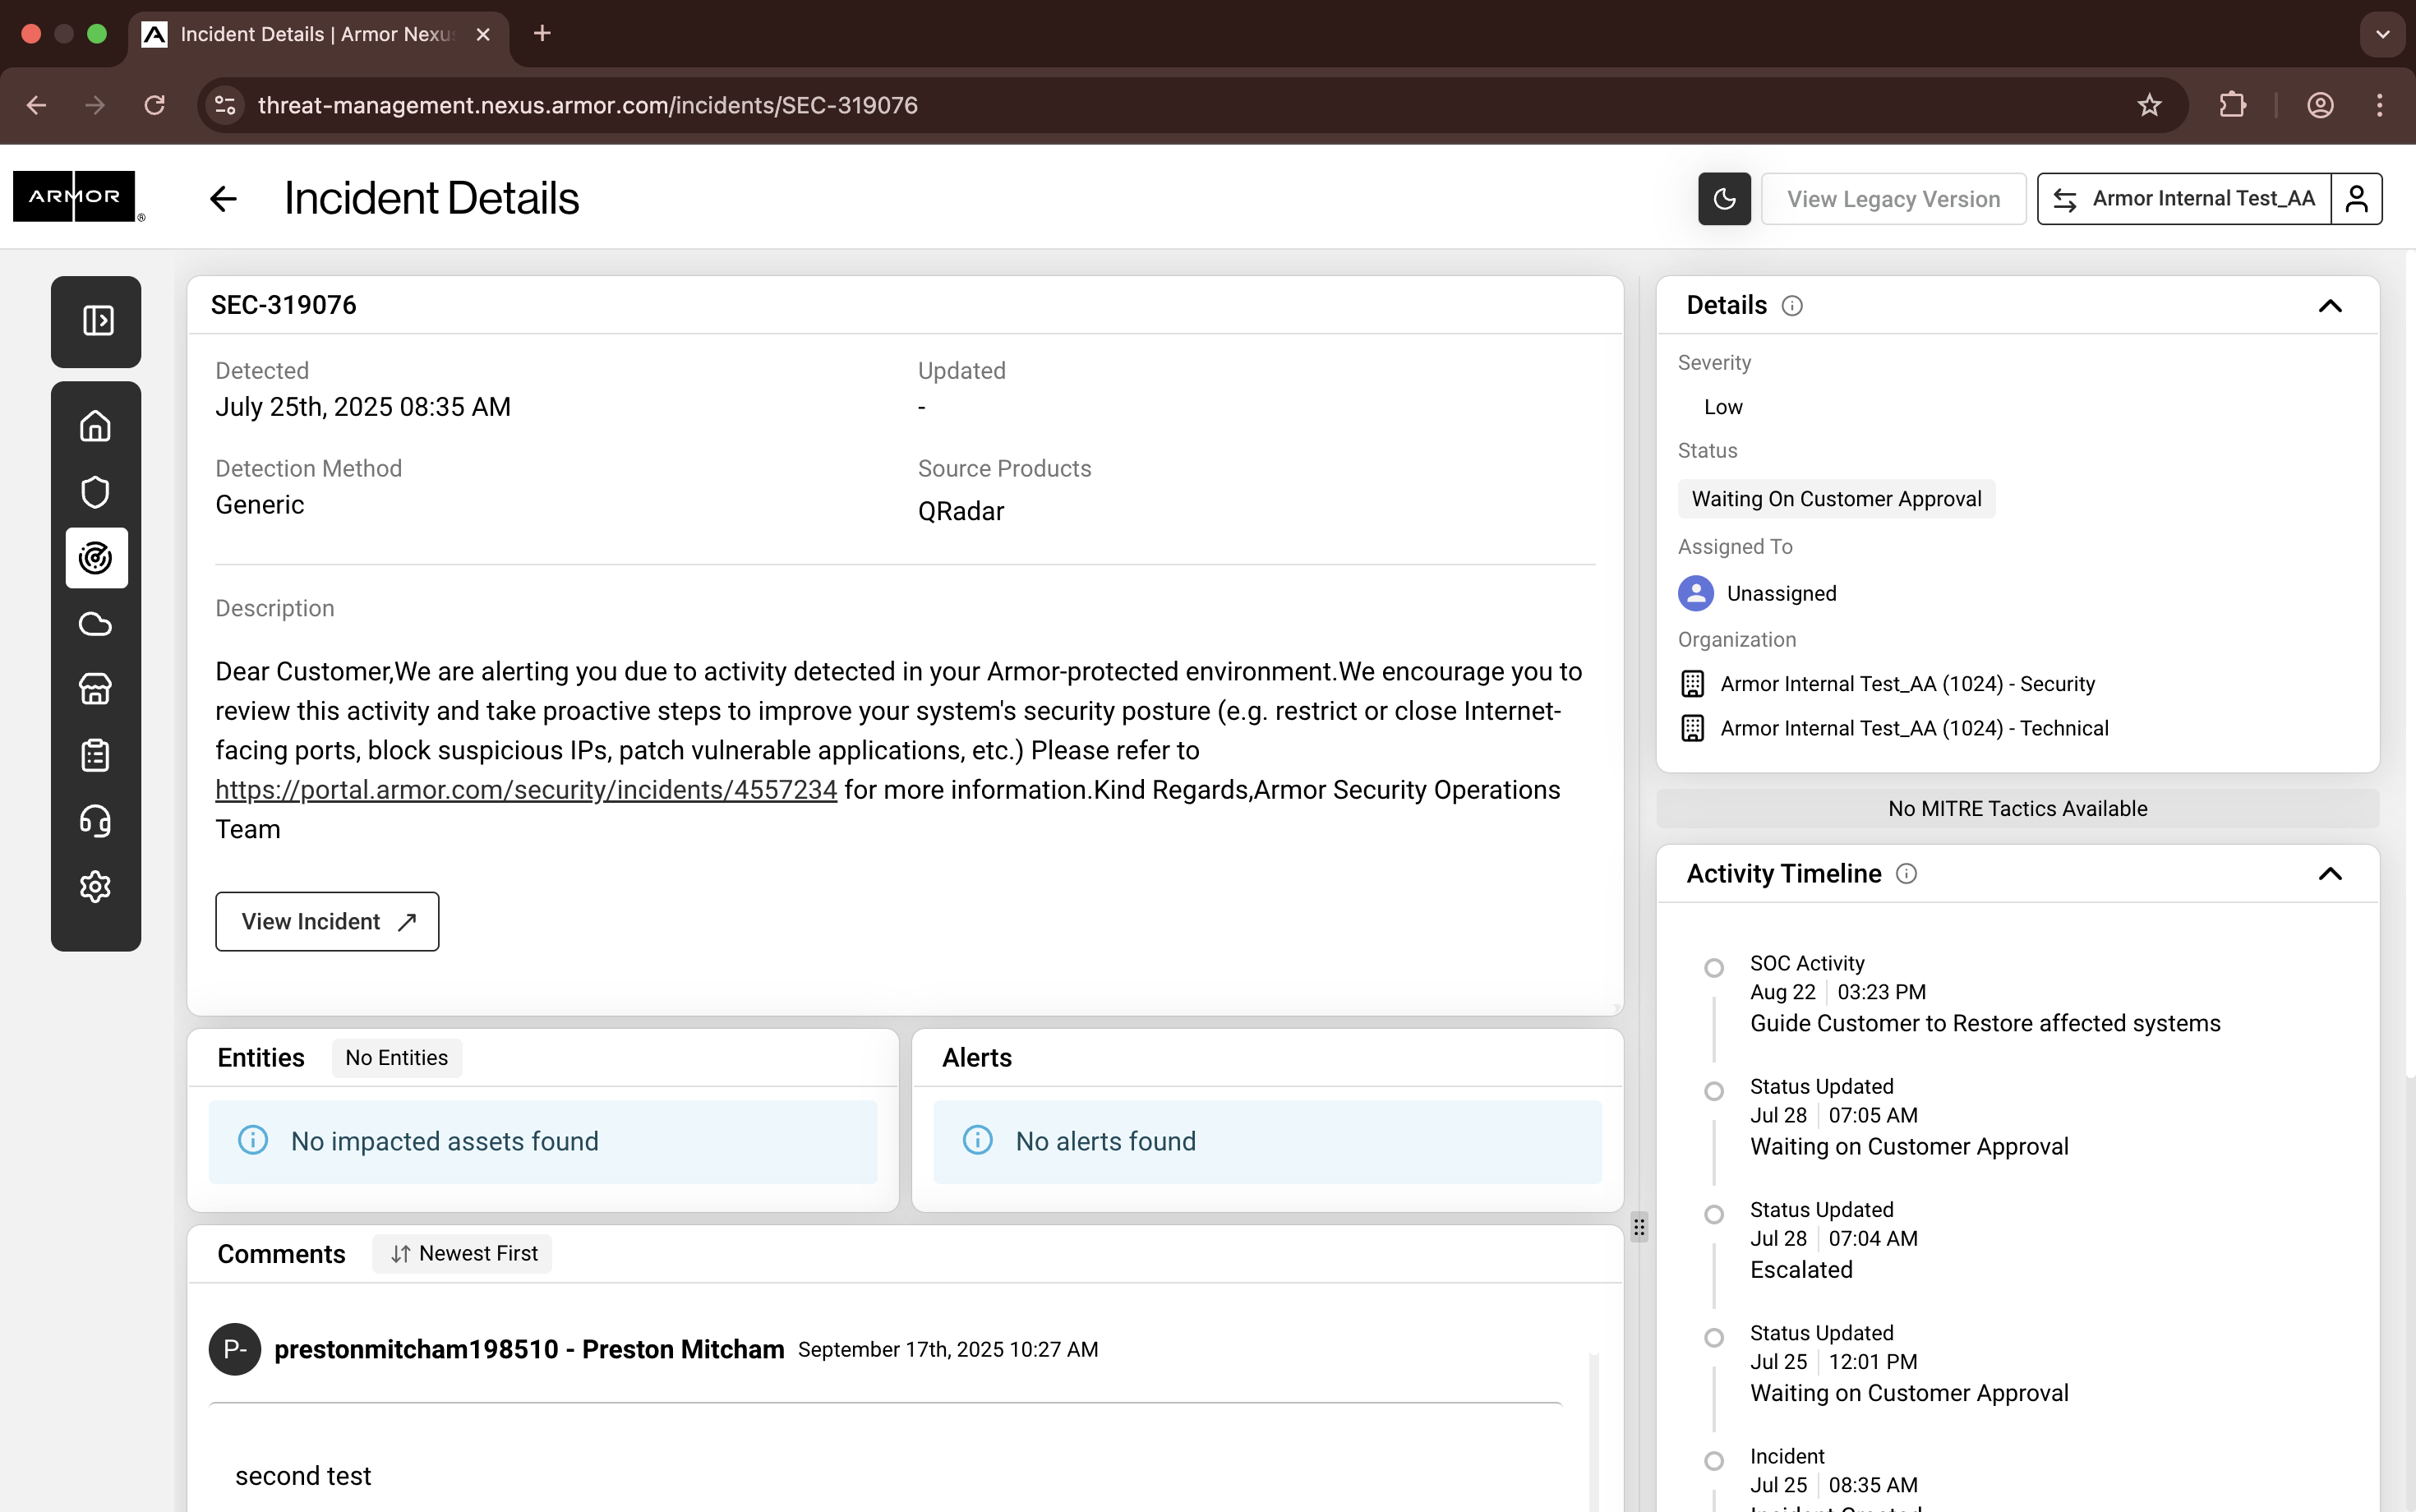
Incident Details Page Overview
The Incident Details page provides in-depth information about a specific security incident. It allows users to review detection details, understand the context, and take appropriate actions.
How to Access Incident Details
Navigate to the Incidents page.
Locate the incident you want to review in the Incident Table.
Click on the Incident ID.
Nexus - Incident Details
Page Layout and Components
1. Incident Header
Incident ID: Displayed at the top (e.g.,
SEC-10000).Detected: Date and time when the incident was first detected.
Updated: Last update timestamp.
Detection Method: Indicates how the incident was detected (e.g., Generic).
Source Products: The security tool or source that generated the alert (e.g., QRadar).
2. Description
Provides a detailed explanation of the incident.
May include:
Reason for detection.
Recommended actions (e.g., restrict internet-facing ports, block suspicious IPs).
Links to additional resources or documentation.
3. Action Button
View Incident: Opens the original incident source or related details.
4. Entities
Displays impacted assets or entities.
If no assets are linked, it shows No impacted assets found.
5. Alerts
Lists alerts associated with the incident.
If none exist, it shows No alerts found.
6. Comments
Displays comments in chronological order with timestamps.
Users with the appropriate permissions can use this section to communicate with the team, share updates, or request additional information.
7. Details Panel (Right Sidebar)
Severity: Indicates the incident’s severity level (e.g., Low).
Status: Current workflow status (e.g., Waiting on Customer Approval).
Assigning To: Shows assigned analyst or team (or Unassigned).
Organization: Lists the organization(s) linked to the incident.
MITRE Tactics: Displays mapped MITRE ATT&CK tactics (if available).
8. Activity Timeline
Chronological log of all actions and updates related to the incident.
Includes:
SOC activity notes.
Status changes.
Escalations.
Customer communications.
Access the Incidents Screen
In Nexus, click Security.
Click Incidents.
The default view is pre-filtered to display incidents only. Click Filters + Settings to adjust the view to also display detections.
Column | Description |
|---|---|
ID | This is the unique ID of the security incident. |
Start Time | The time stamp of the first event of the incident. |
Summary | A brief description of the incident found. |
Severity | There are four severity types:
|
Tags | Armor will "tag" a detection with Incident if it requires security attention, and is a potential threat. |
Events | A count of events that triggered a detection or incident in the Armor correlation engine. |
Status | The current status of the incident or detection.
|
Expand the row to view the First and Last Event Date.
Click Filters + Settings to filter the data that displays in the table.
Filter by Severity, Tags, or Status.
Click Apply Filters to save your changes.
In Table Settings, you can customize the view of your table.
Click Save Settings to save your changes.
View Incident Details
In Nexus, click Security.
Click Incidents.
Locate and select the incident that you want to view.
Incident DetailsField
Description
Full ID
This is the unique ID of the alert.
First Event Date
The date and time of the first event tracked for this alert.
Last Event Date
The date and time of the last event tracked for this alert.
Status
The status of the detection/incident.
Event Count
The total number of events tracked for this alert.
Categories
The categories used by Armor to group detections, based on the correlation rule(s) that triggered the detection and the associated events.
Event DetailsColumn
Description
Name
The descriptive name of the event.
Source IP
The source network address associated with the event.
Dest. IP
The destination network address associated with the event.
Timestamp
The date and time that the event occurred.
Log Source
The data source of the event log.
Category
The category assigned based on the correlation rule(s) that triggered the detection and the associated event.
Click Filters + Settings to filter the data that displays in the table.
Click Apply Filters to save your changes.
In Table Settings, you can customize the view of your table.
Click Save Settings to save your changes.
View Support Ticket Details
In order to view a ticket, you must be a member of the organization that the ticket was created in.
In Nexus, click Security.
Click Incidents.
Locate and select the incident that you want to view.
Click View Ticket.
The ticket details from the Armor Ticketing System (ATS) will open in a new window.
Close A Security Incident
Only Armor Support can close a security incident. However, after you have performed the troubleshooting tips suggested by Armor Support, simply enter a comment expressing your desire to close the ticket. Armor Support will verify and confirm that the security incident has been properly addressed, and then they will close the ticket.
Troubleshooting
If you do not see any data in the Incidents screen, consider that:
Your account does not have any security incidents to display.
Armor is responsible for adding security-related incidents to this screen.
You do not have permissions to view security incidents.
You must have the Read Security Alerts and Read Security Offenses permissions enabled to view security incidents in this screen. Contact your account administrator to enable this permission. To learn how to update you permissions, see Roles and Permissions.