Reports
Reports in CSPM provide a pass/fail score percentage for a selected mandate against resources in a cloud environment. Mandates are made up of controls that your environment is evaluated against. The accumulation of these pass/fail metrics is delivered as the report.
Create a New Report
Users can Create a Report to begin using new connectors to evaluate environments. The cloud environment associated with the report will be scanned based on the mandate selected.
Duplicate reports cannot be configured for a connector.
In the Armor Management Portal (AMP), in the left-side navigation, click Reports under Compliance.
Click the New Report button.
The New Report form will slide into view from the right side of the screen.
Click the icon of the appropriate Cloud provider.
Amazon Web Services
Google
Microsoft Azure
Select the Mandate to be used for the environment.
Create a descriptive name for the report.
Select the connector or connectors you wish to include in the report.
Selecting multiple connectors will roll each of those environments up into this one report.
Click the Create Report button.
View An Existing Report
In the Armor Management Portal (AMP), in the left-side navigation, click Reports under Compliance.
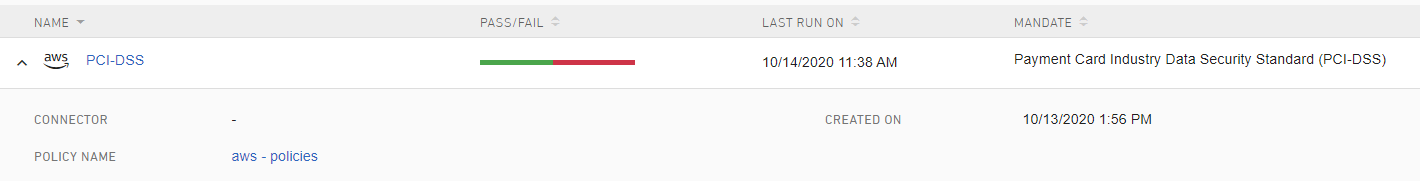
Click the link to the Report listed in the Name column.
Expanding the view of the report will display the Connector, Policy name, and Created On date for the report.
AMP will only display the most recent report.
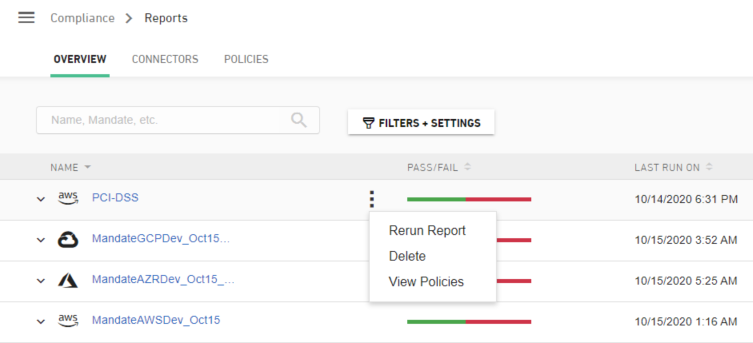
In the Overview screen, hovering over a report will then display three dots you can click on . From here, users can:
Rerun Report, which updates the results.
Action is limited to once every 4 hours
Delete a report
View Policies within a report, which takes the user to the Policies tab
Tab is filtered to display policies included in the report
Clicking on the drop down arrow next to the name of the report shows additional details:
Connector - connector name associated with the report
Created On - the created on date for the report
Policy Name - grouping of policies that are associated with the report
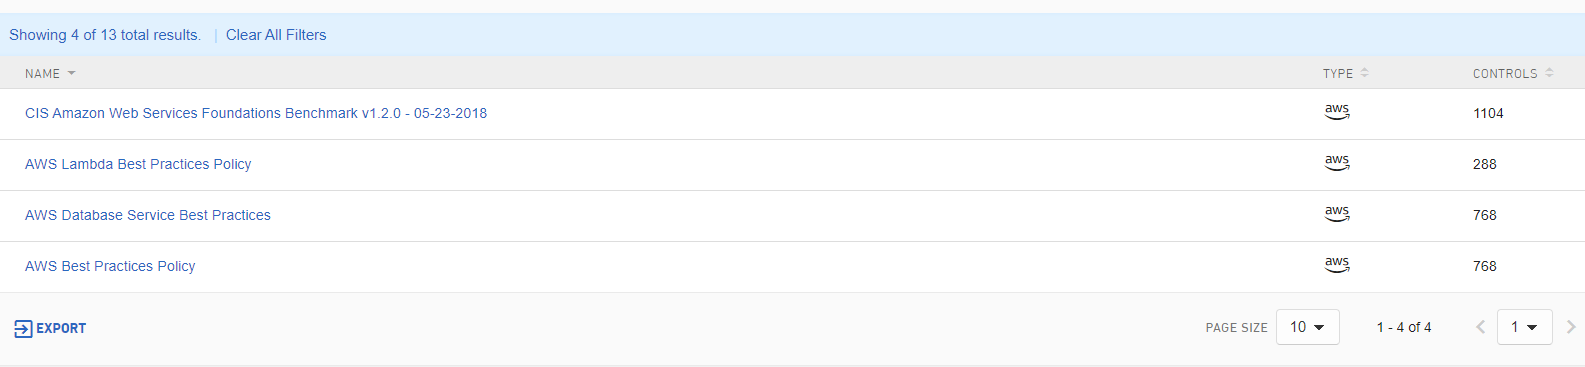
Users can click the Policy Name link to view a list of policies belonging to the mandate selected when the report was created.
Understanding Reports
Users can click on the name of the report to view the report details page which contains the results of the environment scan. Depending on the mandate selected for that report, the details will be displayed and should look something like the below:
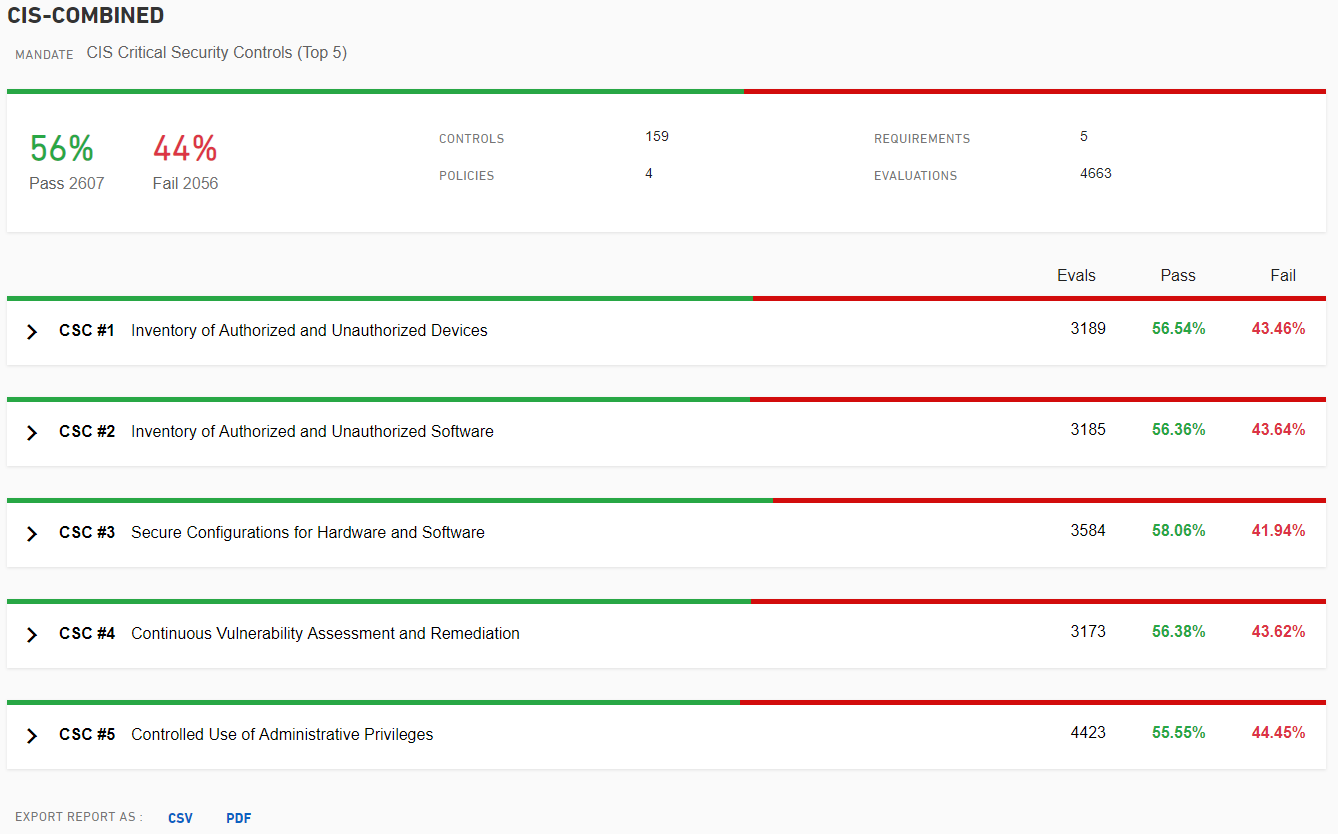
The report summary section at the top contains:
Pass/Fail rate with the number of resources associated.
Controls - This is how many total controls are part of this report.
Policies - This is how many policies the selected mandate contains.
Requirements - Total number of requirements as part of the mandate.
Evaluations - Total number of resources in the cloud environment that were evaluated.
At the bottom of the report details are options to export the report to CSV or PDF.
Here all the requirements for the mandate selected when creating the report are visible. The report will display the Pass/Fail percentages at each level as the requirements and sub-requirements are expanded. At the lowest level the individual controls that make up the requirements are shown as displayed below:
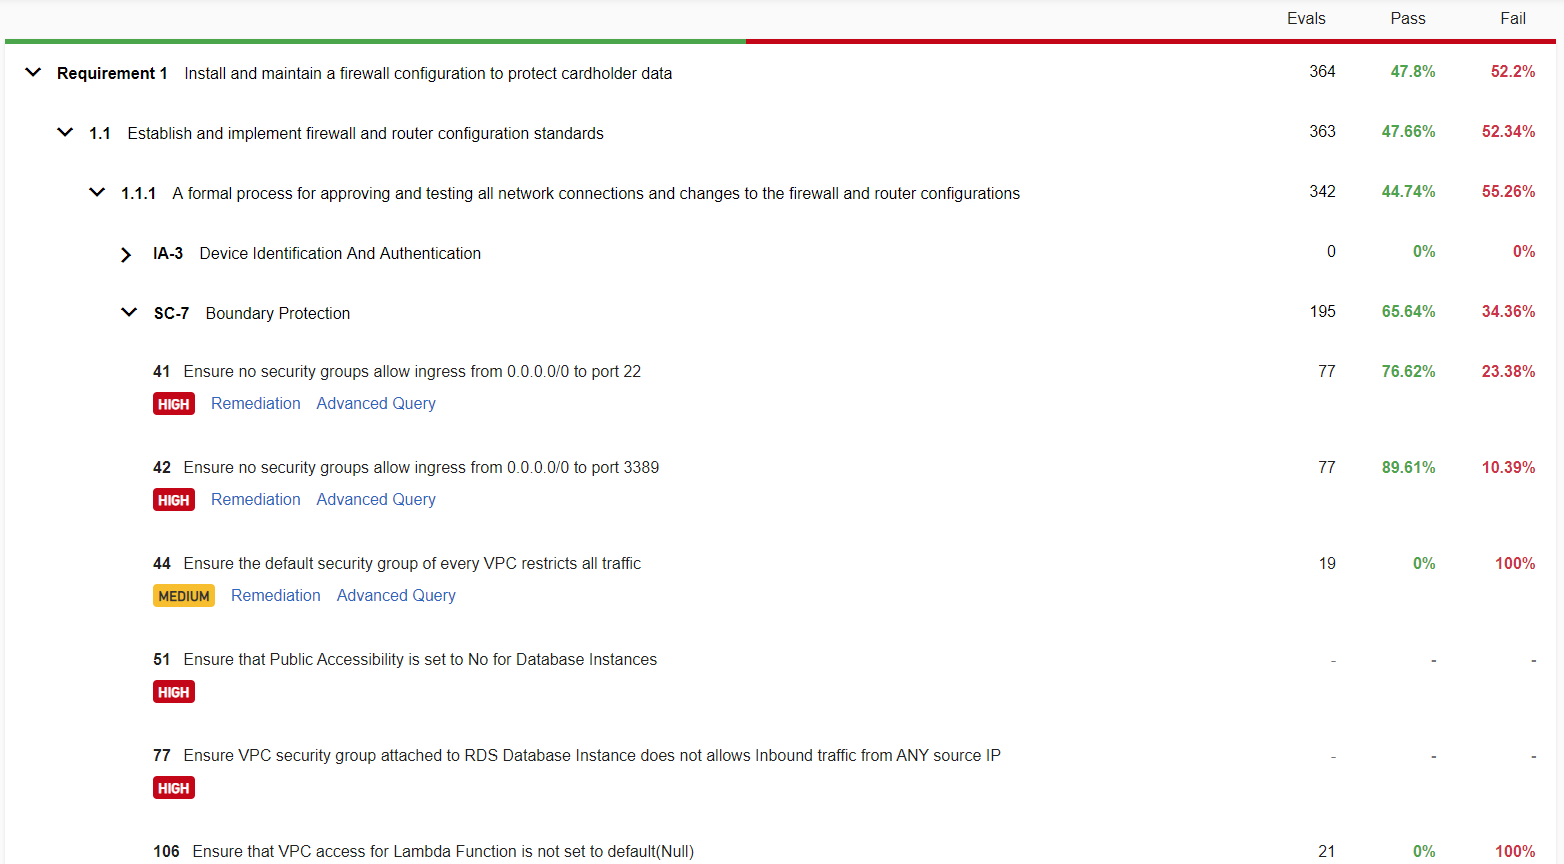
At this level the control id is on the left and the pass rates for each individual control are on the right as well as how many resources were evaluated for that control. Under each control there are two links: Remediation and Advanced Query.
All data in CSPM is driven by reports. Report data is not automatically updated. If changes have been made to the environment, to see the effects of those changes, a report will need to be re-run. Re-running a report will update relevant data on all the tabs. How to re-run a report is explained in the View An Existing Report section of this page.
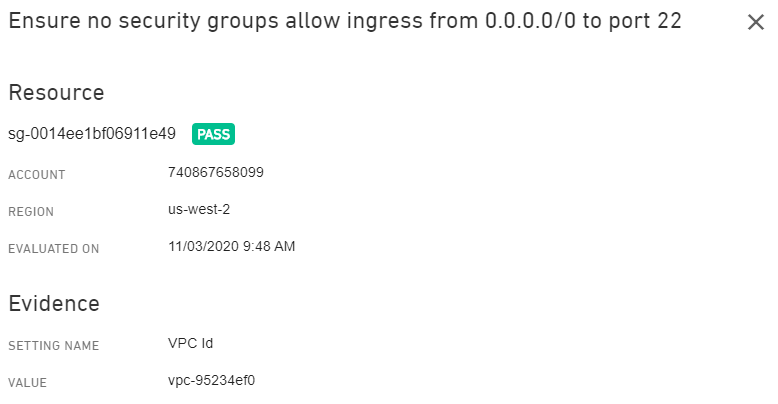
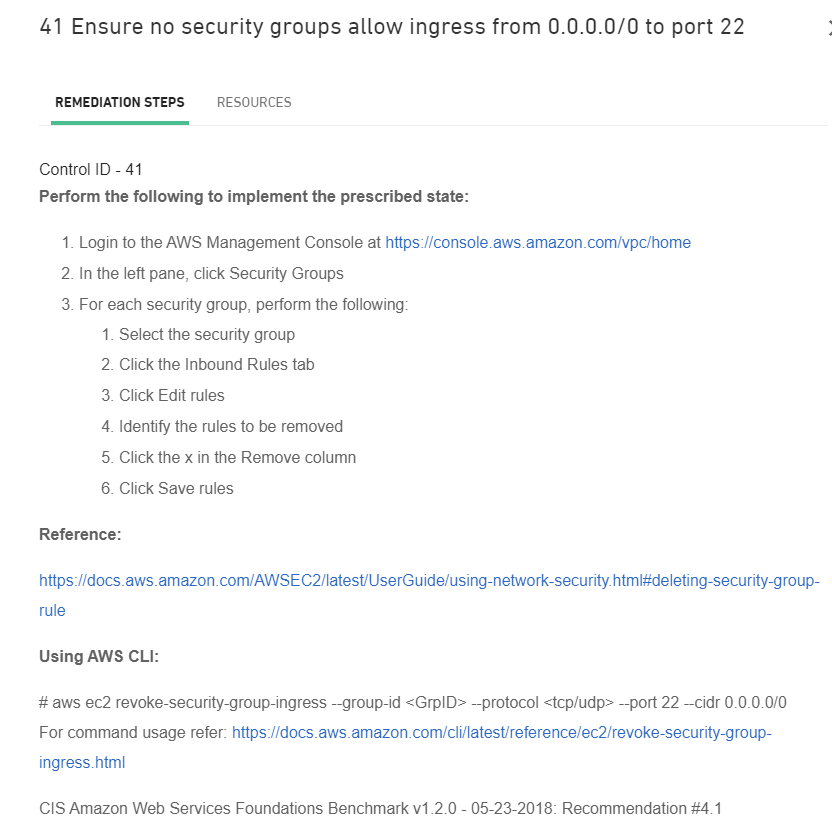
Remediation
For each control, there are remediation steps and the resources that were examined for that particular control. Following the remediation steps for each resource that did not pass will allow that control to become a pass after the report is run again.
The Remediation link will open up additional tabs in a sidebar where you can get the remediation steps and resources for the control as shown below:
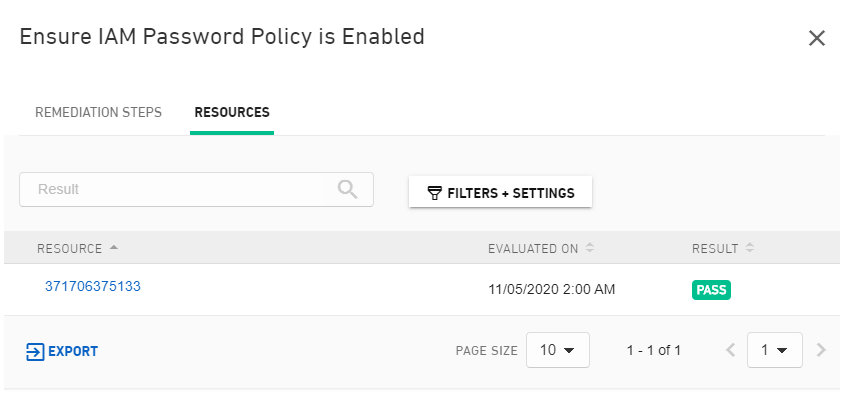
Resources
The Resources tab shows only the resources that have been evaluated per the mandate chosen for a report. Mandates test against specific controls, so if a resource is not in scope for a control, it will not appear in the Resources tab. In other words, the Resources tab is not a table of all a customer's assets, but rather a list of those assets that have been included in a report.
Due to the large volume of data for resources, it can take a while for the data to populate even after the report has been run and has results. Shown below, by clicking on the Export button resources can be exported to CSV.
By clicking on the resource name, details for the resource can be seen as shown below: