Compliance in AMP
Compliance In AMP
In the Armor Management Portal (AMP), clicking the COMPLIANCE section link in the left hand navigation will take you to Compliance > Cloud-Posture. From here, CSPM provides a series of dashboards visible under three tabs:
Overview
Connectors
Policies
Overview
The Overview screen displays a list of reports configured for the various enterprise cloud environments. Users can view results and details for a report by clicking a report link in the list provided. Each report is associated with a particular cloud connection. Multiple reports can be configured per connection. The New Report button is used for configuring new reports.
Duplicate reports cannot be configured for a connector.
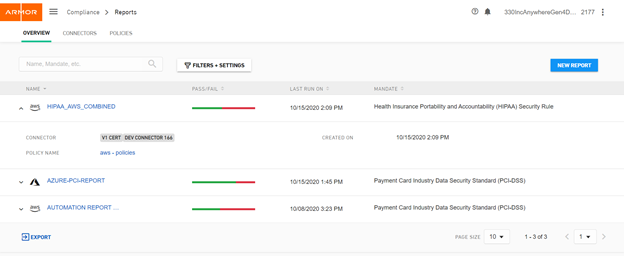
The Export link allows the full or filtered list of reports to be exported to a csv file. The csv file will contain all the columns, regardless of the settings set for the page.
Created reports without finished pass/fail data will display a grey pass/fail. Once complete, the bar will appear using green and red for pass and fail, respectively.
Hovering over the Pass/Fail bar displays the current percentages.
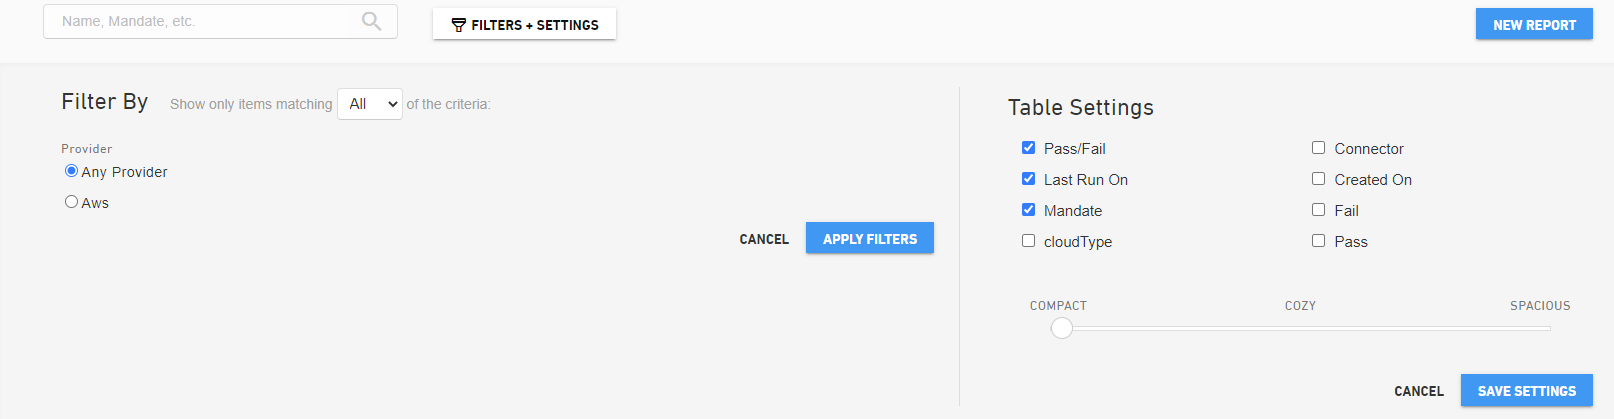
By default, the Name, Pass/Fail, Last Run On and Mandate columns for each report are displayed. In the Filters and Settings menu Pass/Fail, Mandate or Last Run On can be removed if desired.
Users can also filter by provider type if a connector has been configured for that particular provider.
Resources
The resources tab is a summary of all resources (AWS, Azure, GCP) that were discovered across all created reports. This tab shows a summary of controls and resources and a list of all resources discovered. Clicking on the name of the resource will open a modal showing the controls associated with that resource and additional details. This allows viewing of all failing controls (or passing) for a given resource across multiple reports.
Resource List
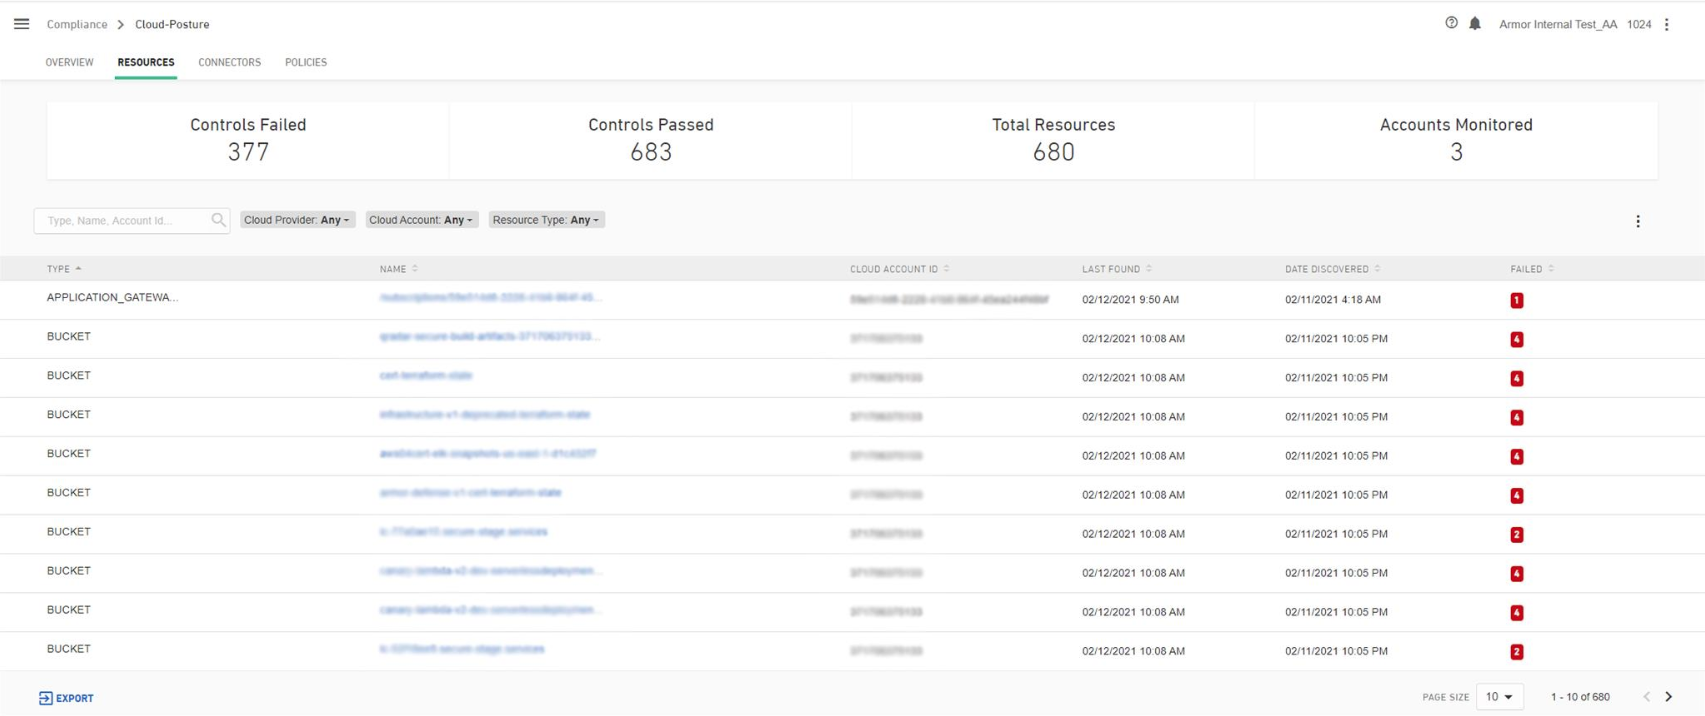
The tab is divided into two sections: a summary section and the resource list table.
Summary
The summary section gives you totals across all the resources on this page. As filters are applied, the summary statistics are updated.
Controls Failed - total number of failed controls across all resources
Controls Passed - total number of passing controls across all resources
Total Resources - total number of resources discovered
Accounts Monitored - total number of accounts with connectors configured
To the right of the filters there are three dots. Clicking those allows columns to be removed from the view. The name column cannot be removed from the view.
Resource List
There a number of filters pertaining to the resource list. The search box allows for searching on Type, Name and Id. Then there are three filters: Cloud Provider, Cloud Account or Type. One or more filters can be applied to the list of resources.
The resource list has the following columns:
Type - resource type based on cloud provider (instance, load balancer, s3 function, etc.)
Name - name of resource in cloud provider
Cloud Account Id - account id the resource belongs to
Last Found - timestamp of the most recent report containing this resource
Date Discovered - first time this resource was discovered
Failed - total number of failed controls for this resource
The list of resources and associated data can be exported to CSV format on the bottom left of the page.
Resource Details
Upon clicking the name of a resource, the controls evaluated modal will display. This shows all the controls across across all reports for the named resource. The information section at the top lists the same details as the main resource page: type, cloud account id, last found, date discovered and region. As filters are applied, the summary statistics are updated.
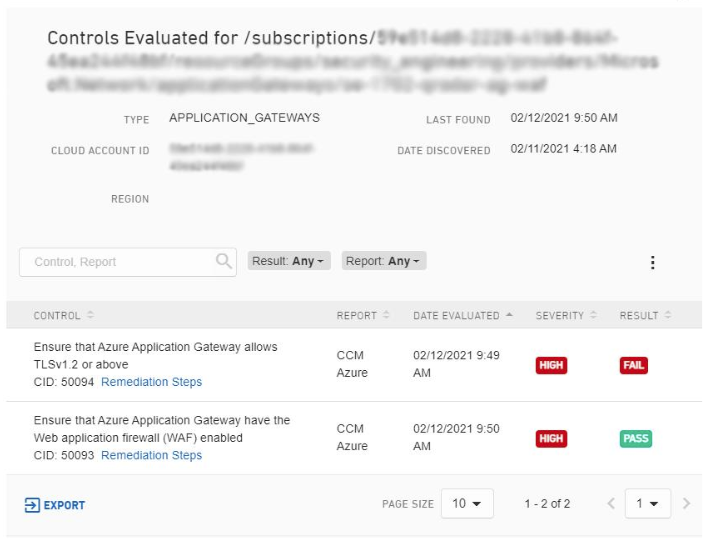
There are a set of filters as well as a search bar for the list. Searching works with the control and report columns. Filters can be applied to the Result or Report columns. This allows for narrowing down the data in a number of useful ways. For instance, a specific control, report and result.
The list section of the resource details modal contains:
Control - the control the resource was evaluated against
CID - this is the control id number for the report
Remediation Steps - links to the remediation steps for the control
Report - the report the control belongs to
Date Evaluated - the date the control was last evaluated
Severity - security risk associated with the control
Result - was the control passed or failed
At the bottom of the resource detail modal the list of controls and associated data can be exported to CSV. Due to the large volume of information, exporting is limited to the current selection. Setting page size to 100 allows for the maximum sized export.
All data on the resource page and details page are driven by reports. To see changes for dates, controls or resources, the corresponding report will need to be re-run from the Overview page.
Connectors
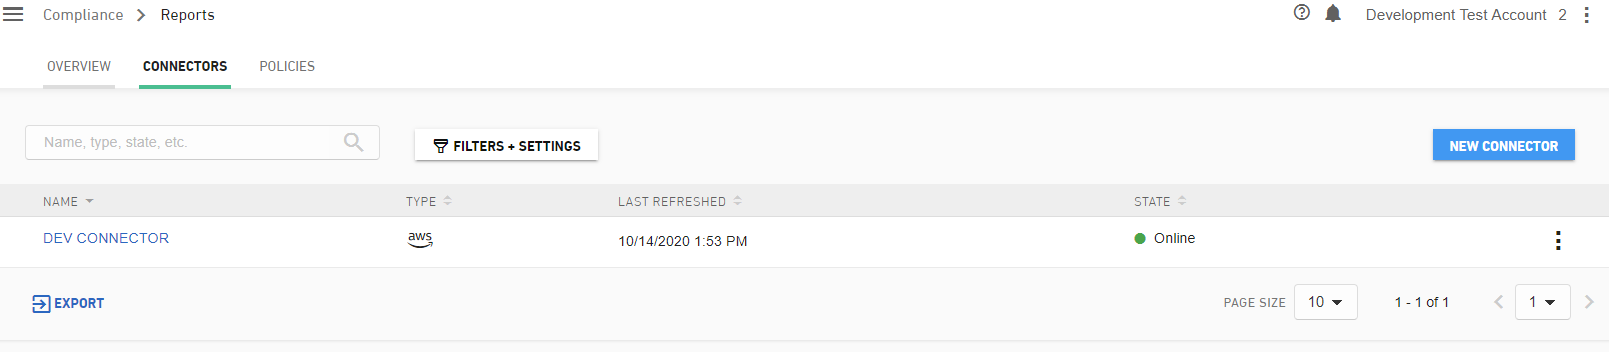
The Connectors tab is where you configure the connection to your cloud (AWS, Azure or GCP) environment. Each type works a little differently and the modal will guide you on setting up a new connector. Here you can see all the connectors you have created, the type, when they were last refreshed and their current status. You also have the option of refreshing the connector state, viewing the details or deleting the connector.
There are four columns on the page that show the name of the connector, the type (AWS, Azure, or GCP), when it was last refreshed and the current state.
The connector can be in one of four states.
Online - The connector is working.
Pending - The connector was just created and awaiting confirmation that Qualys can connect to the account.
Refreshing - The connection was refreshed and is awaiting confirmation that Qualys can connect to the account.
Offline - The connection is not working. This could be because the permission was removed on the cloud environment side or a service interruption has occurred on the Qualys or provider side. Examples being:
AWS, GCP or Azure has a service outage.
Qualys has a service outage.
A role or permission was removed from the provider (AWS, GCP or Azure).
In the event that a connector is stuck in pending or offline please follow the troubleshooting documentation.
It is important that users do not simply attempt to delete and re-add a connector to resolve a bad state, as billing is determined by each active connection.
Policies
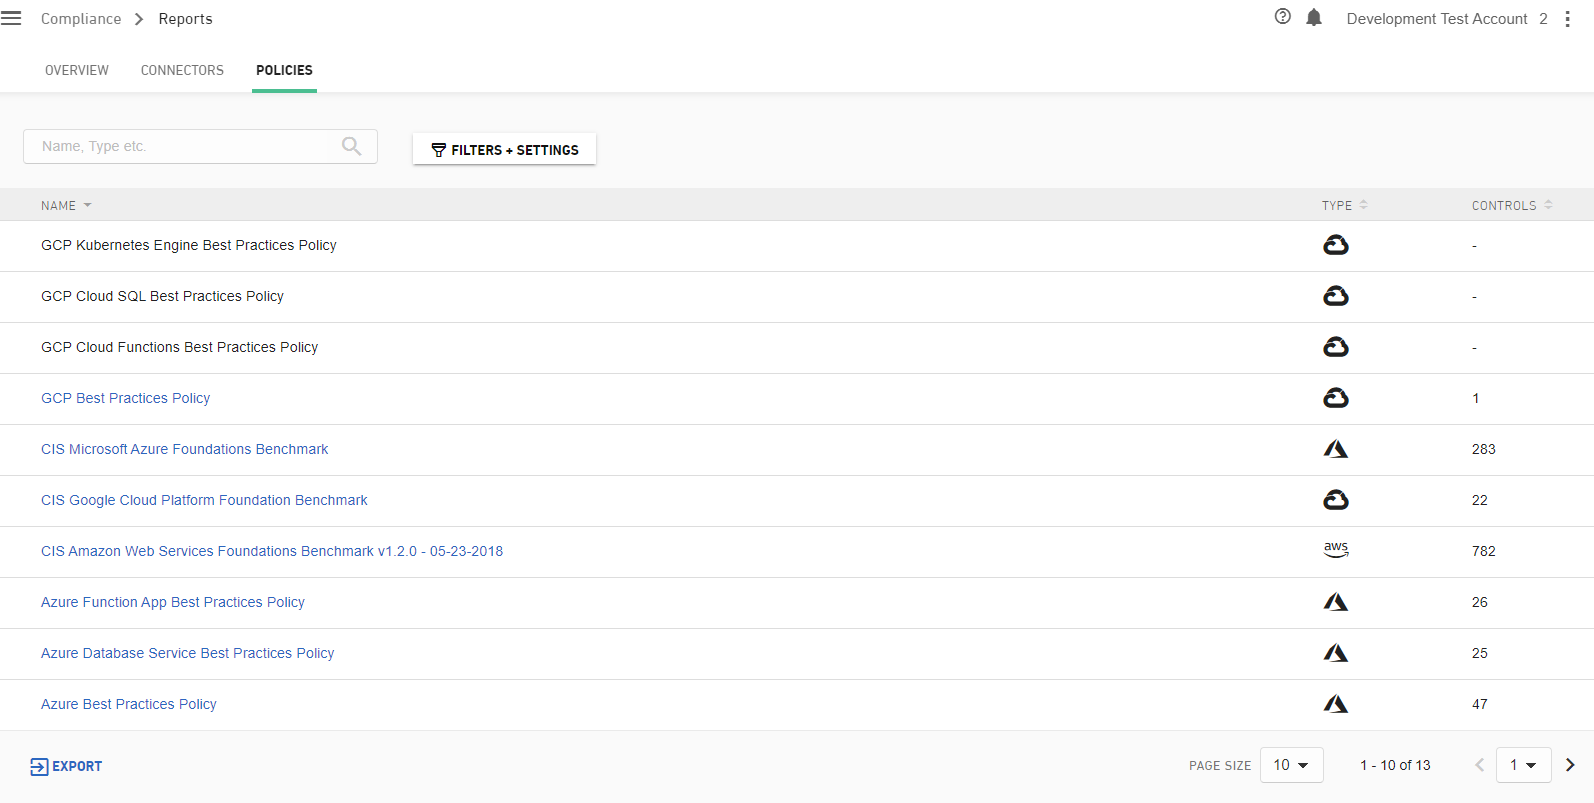
The policies page displays the various policies that exist and what controls those policies contain. Mandates may include one or more policies and thus the controls in each of those policies. Policies are not editable and there is no configuration done on this page.
Creating a report for PCI DSS using the API
Example workflow for setting up a report to do PCI scanning for an AWS cloud environment via the API. Example calls are available in the API docs.
API Calls:
Create the ARN role for AWS that allows for doing a security audit on the environment.
Armor's AWS account number and an external id will be needed. Both are used in creating the ARN Role. Hit the following endpoint to get the account number and external id
The external id and Role ARN will be needed for the next step as well.
POST Create a connector - /cspm/connector
GET List connectors - /cspm/connector
Validate that the connector shows in the list and was successfully added.
Ensure the connector is On (This may take a few minutes after creation).
Get the connector id or ids for use in the next step.
POST Create report configuration - Create the desired report for the cloud environment.
GET Report details - Get the report data (results)