Endpoint Detection Visualizations
Severity Resources & Threat Breakdown
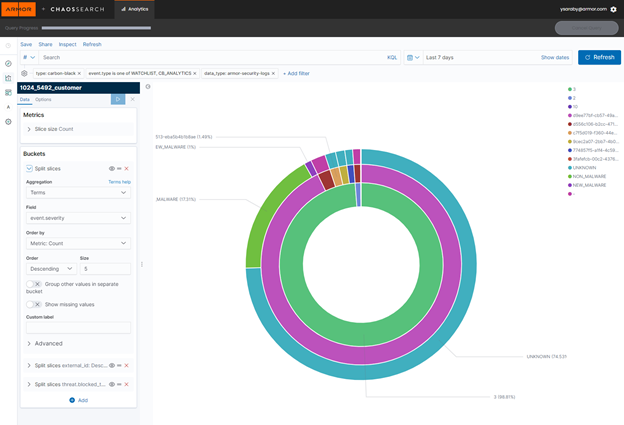
The Severity Resources & Threat Breakdown report provides visualization broken by Severity and Threat Category for resources. Most inner group shows the severity; middle circle reflect the assets and severity; the outer circle show the Threat category.
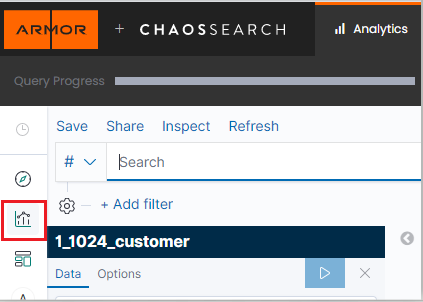
In Nexus, hover over Threat Management
 on the left-side nav.
Click Log Search.
Then click Log Search tab on the top of the page.
Wait for the SSO.
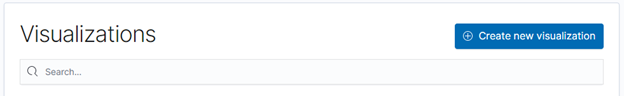
Click on Visualizations
Click the Create new visualization button.
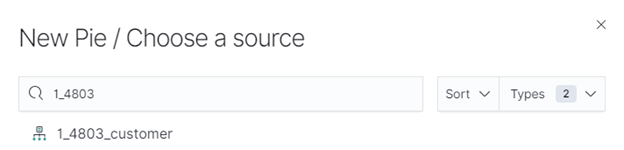
In the New Visualization pop up, select the Pie visualization option.
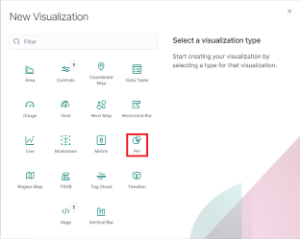
Choose a source.
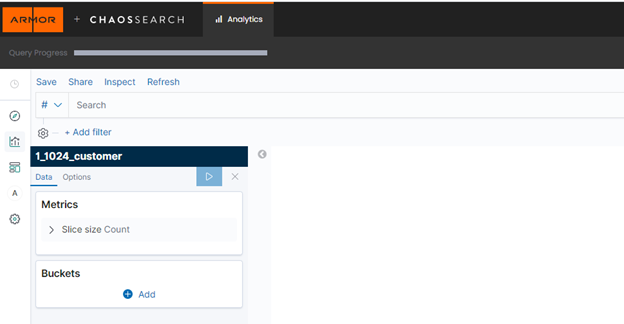
Log Search will refresh to display the query screen. From here, the visualization can be configured.
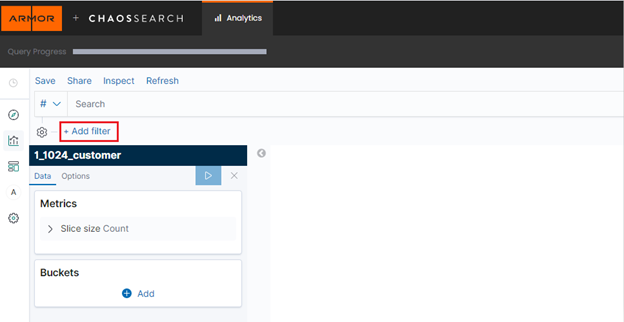
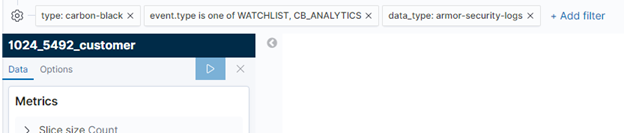
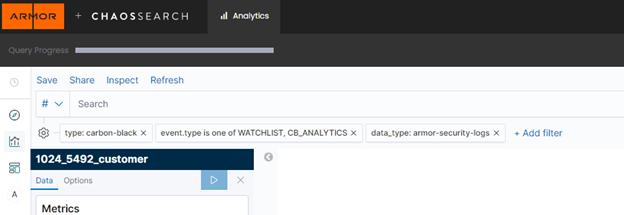
Click Add filter.
Populate the following filters (Case sensitive):
Field
Operator
Value
Note
type
is
carbon-black
event.type
is one of
WATCHLIST, CB_ANALYTICS
Data_type
Is
armor-security-logs
event.severity
Is one of
8, 9, 10
Optional if you want to filter higher severities
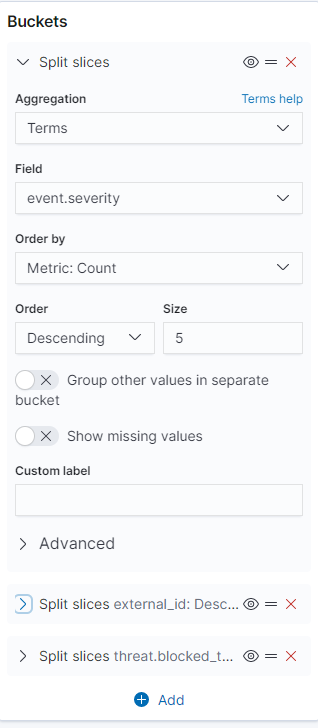
Two buckets are needed to configure this visualization. Under Buckets, click the Add button, making sure to select split slices.
In the Aggregation drop down, select Terms.
In the Field box, enter "event.severity" or search for it.
Order by, Order and Size should all remain with their default values. Properly configured, the first bucket will look like the screenshot below:
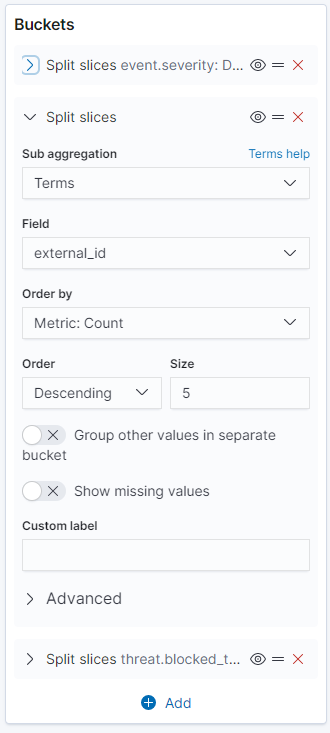
To add the second bucket, click the Add button underneath Buckets, making sure to select split slices.
In the Sub aggregation dropdown, select Terms.
In the Field, enter "external_id" to select it. (External Id is the same as CoreInstanceId)
Order by, Order and Size will be set to default. Properly configured, the second bucket will look like the screenshot below:
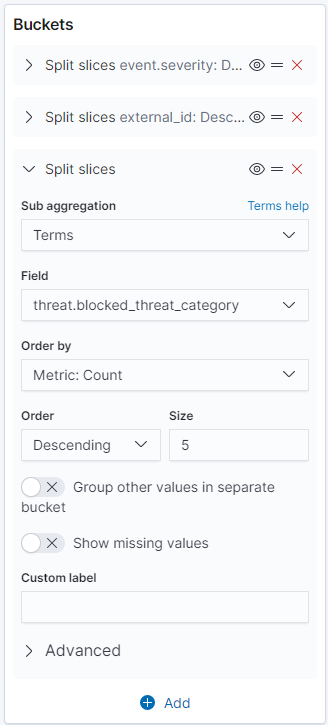
To add the second bucket, click the Add button underneath Buckets, making sure to select split slices.
In the Sub aggregation dropdown, select Terms.
In the Field, enter "threat.blocked_threat_category" to select it.
Order by, Order and Size will be set to default. Properly configured, the second bucket will look like the screenshot below:
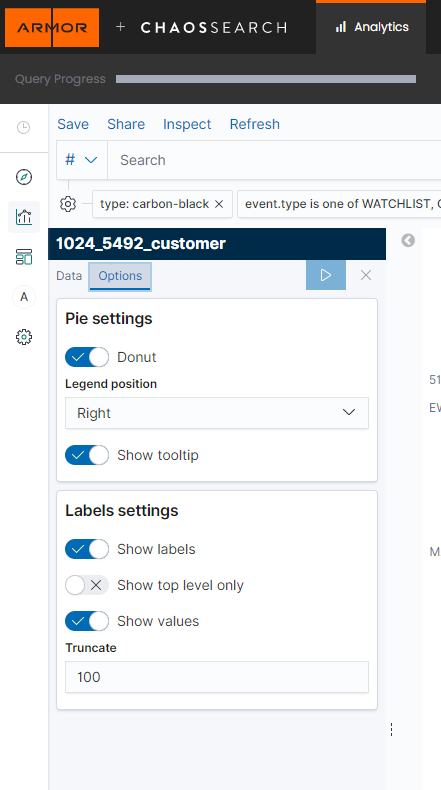
Optional step if you like to display labels, click Options tab:
When both buckets are configured, click the Apply Changes button.
Set the date range for the visualization.
If the range encompasses more than one report, an additional filter with the report id can be added.
Save the visualization by clicking Save in the top left of the screen.
Users can view previous visualizations by clicking Visualizations and selecting the desired visualization from the list.