Skip table of contents

Using the Datalake for Incident Detection

Understanding the Datalake


The Armor data lake is a centralized repository for storing Armor collected data. With regards to vulnerabilities, the data lake contains all the data for every report created for an environment and all the historical data from when the reports are run. This can be a lot of data so narrowing down the scope of information is critical to making sense of it all.

Accessing the Datalake


Users can access the datalake in two ways:

Option 1: Compliance in AMP
  1. Select a Report from the Report List and click on it’s name to access the details page.

  2. Then expand down to the control level of a section to view links for Remediation and Advanced Query.

  3. Click on Advanced Query.

  4. This opens ChaosSearch in a new window.

  5. Click on the Single Sign On button.

  6. Click Next again on the next page to sign in to ChaosSearch.

  7. Once the page loads the following will show:

  8. Note that there are two filters already being applied based on which control was open when Advanced Query was selected. The ruleId and ReportId.

  9. To see the complete report, click on the X next to the rule.Id and now the filter is only using the ReportId to get data.

    1. Keeping the rule.Id can also be useful for comparing changes over time (using a wider date range) for that rule.

  10. Changing the date range allows for viewing a single or multiple runs of the report depending on the goal.

Option 2: Log Search in AMP
  1. Select a Report from the Report List and click the report name to access the details. 

  2. Copy its unique report Id by navigating into the report’s detail page.

  3. Navigate to Security -> Log Search and SSO into Chaos Search.

  4. Create a filter by doing the following:

    1. Click on Add filter.

    2. In Field select event.ReportId

    3. Select is for Operator.

    4. Paste the report Id from the report details page into the Value field.

    5. Click Save.

  5. Now set the date range to encompass the report date or dates to show and click Refresh.


Data Presentation


Data consists of documents stored in the datalake. Each document contains all the data related to that particular rule and resource. Below are examples of the table and JSON views:

Table Example


JSON Example


The schema for these documents is based on Elastic Common Schema, please refer to the below links for the details and explanation of the fields:

Vulnerability schema - https://www.elastic.co/guide/en/ecs/1.5/ecs-vulnerability.html

Custom Fields:

  • src_ip - the event's source IP

  • src_port - the event's source port

  • parsed.trendmicro.name - the name of the event signature

  • dst_ip - the event's destination IP

  • dst_port - the event's destination port

  • parsed.trendmicro.severity - the severity of the event


Helpful Fields for Searching the Datalake


Field

Filter By

hostname

the hostname of the machine on which the event was sent

data_type

the type of the data being searched for, trend-hids in this instance


Adding a Filter


To add additional filters, click on the Add Filter Button.

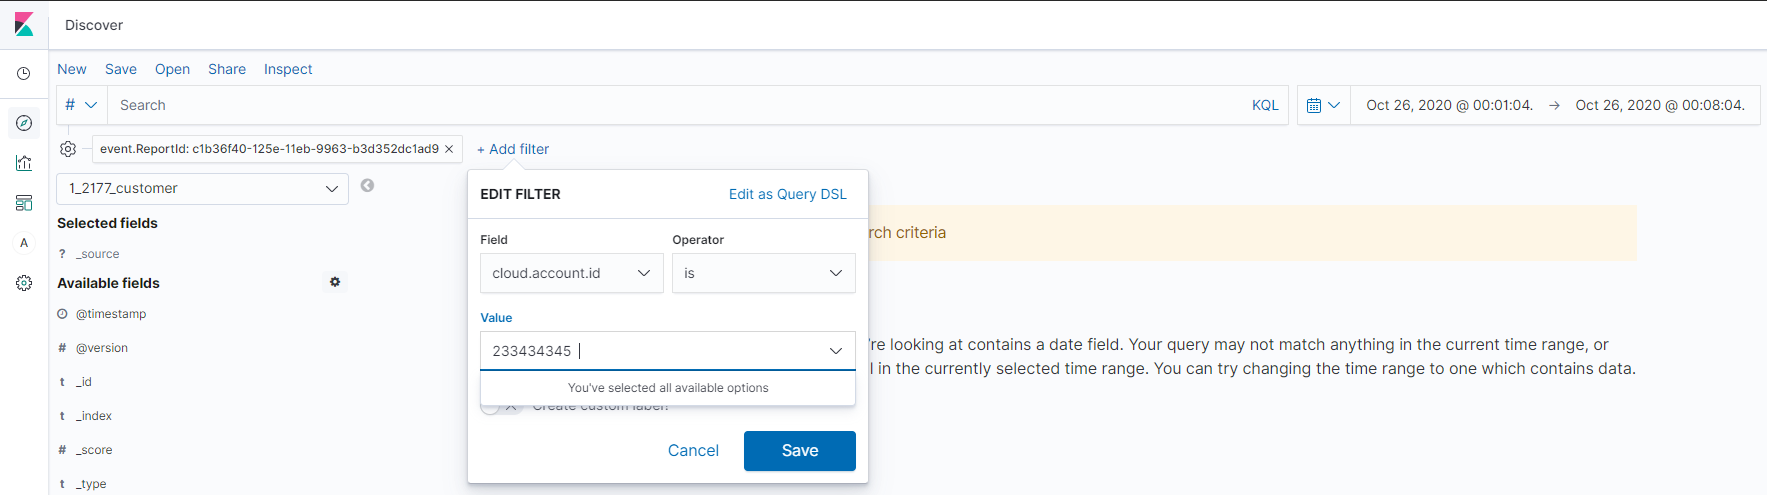
Then set the field to one of the helpful fields above, select the operator, put in the value and hit save. The data is now filtered on a specific reportId, rPolicy or other field selected.

Viewing Datalake Aggregations


Please refer to Reports for custom aggregations, visualizations and custom reports.

JavaScript errors detected

Please note, these errors can depend on your browser setup.

If this problem persists, please contact our support.