Armor Health Overview Dashboard
Nexus Overview Dashboard
To fully use this screen, you must add the following permission to your account:
Read Dashboard Statistics
You can use the Health Overview screen to see the overall health status of virtual machines that contain the installed Armor Anywhere agent.
If you are a new user, then you may need to install the Armor Anywhere agent in order to receive data to populate this screen.
To learn how to install the agent, see Installation.
The Dashboard provides a comprehensive view of your environment’s security posture, updated nightly at 2:00 AM UTC. It includes key metrics and visuals to help you monitor trends, identify vulnerabilities, and assess service health and coverage.
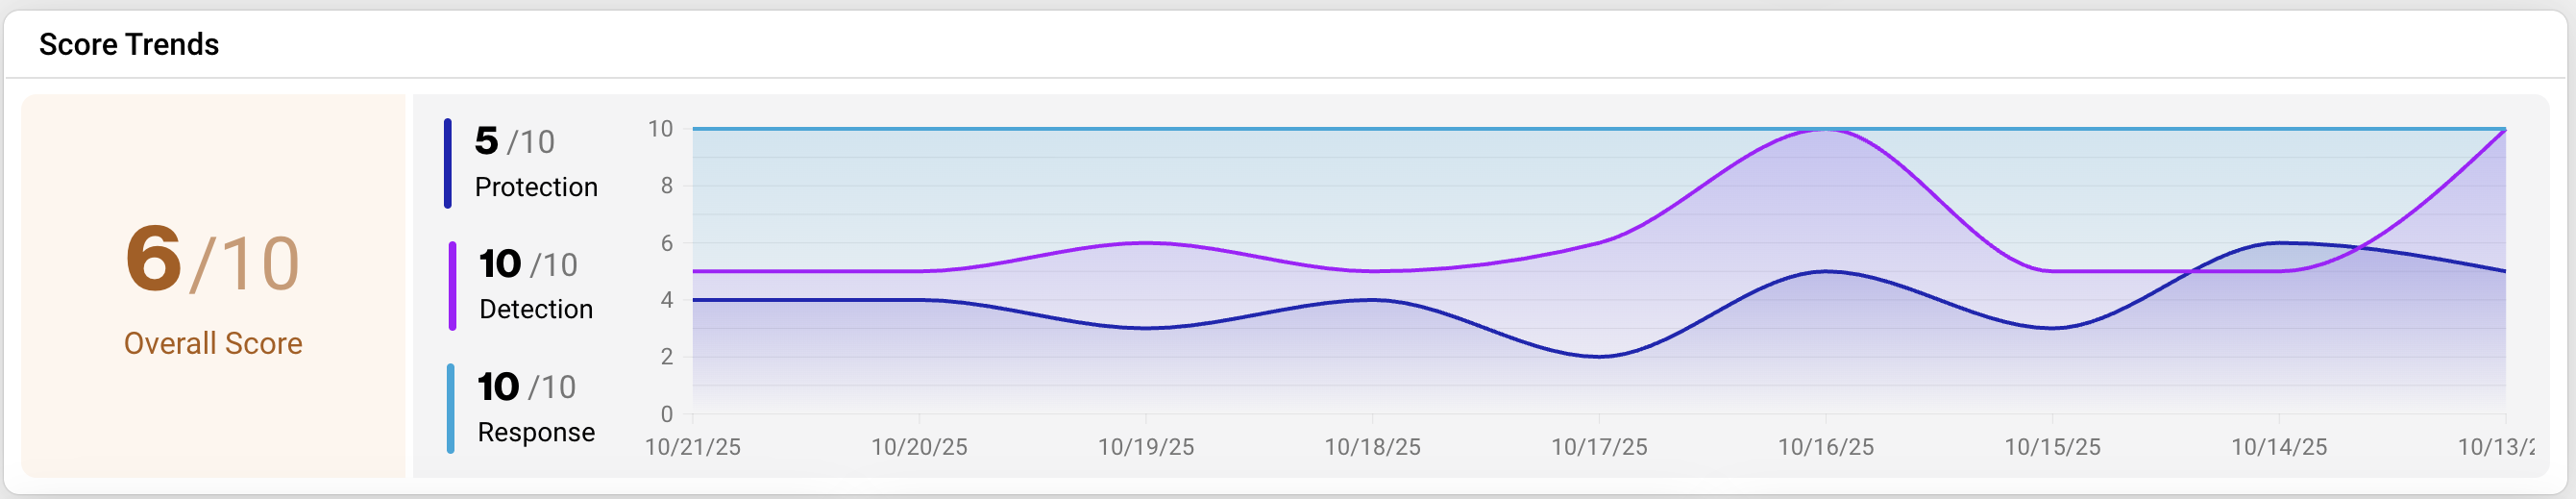
1. Score Trends
This widget displays four scores over a 7-day timeline:
Overall Score: A weighted average of the Protection, Detection, and Response scores.
Protection Score: Based on the stability of the Armor agent and its subagents.
Detection Score: Based on log activity received from the Armor agent and subagents.
Response Score: Based on the response time between you and Armor Support for security-related tickets.
Use this visual to track score fluctuations and identify patterns in your security posture.
Nexus - Score Trends
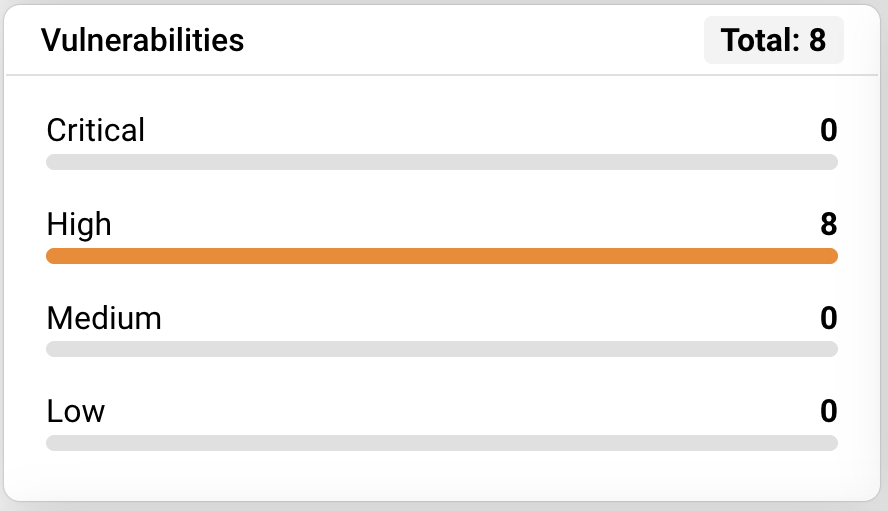
2. Vulnerabilities
This widget shows the number of detected vulnerabilities from the latest weekly scan (performed every Sunday at 10:00 PM local server time). It includes:
Total Vulnerability Count
Breakdown by Severity (excluding informational alerts)
Note: The count may differ from the scan report in Nexus, which includes informational alerts (Severity = Info).
Nexus - Vulnerabilities
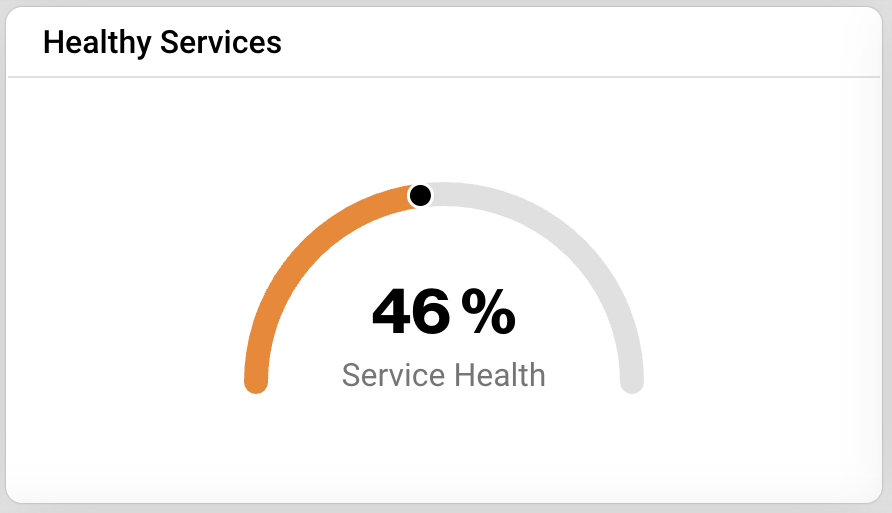
3. Healthy Services
This widget displays the percentage of healthy services across your environment.
What is a “service”?
Armor installs several security services on each of your servers. Each service handles a specific security function:
Service | What it does |
|---|---|
Armor Agent | The core agent that coordinates all other services and sends regular heartbeats to Armor. |
Malware Protection | Scans for viruses, malware, and other threats (powered by Trend Micro Deep Security). |
File Integrity Monitoring (FIM) | Watches for unauthorized changes to critical system files. |
Intrusion Detection (IDS) | Monitors network traffic for suspicious activity. Available on Armor Anywhere. |
Log Collection | Forwards system and application logs to Armor for analysis (Filebeat on Linux, Winlogbeat on Windows). |
Vulnerability Scanning | Runs weekly scans to identify known software vulnerabilities. Available on Armor Anywhere. |
Endpoint Detection (EDR) | Advanced endpoint monitoring via CrowdStrike or Sophos, if configured for your account. |
A single server typically runs 5 to 8 of these services, depending on your product and configuration.
When is a service “healthy”?
Armor checks each service against a set of health rules that run every hour. A service is considered healthy when it passes all of its checks:
Check | What it verifies |
|---|---|
Installed | The service software is present on the server. |
Enabled | The service module is turned on (not just installed but inactive). |
Communicating | The service has sent a heartbeat to Armor within the last 4 hours. |
Producing data | The service is actively generating log or event data. |
If any of these checks fails, that service is marked as Needs Attention.
Example
Suppose you have 10 servers, each running 5 services. That gives you 50 total service instances across your environment.
If all 50 are passing their health checks, Healthy Services shows 100%.
If 3 services are failing (for example, Malware Protection on one server stopped sending heartbeats, andLog Collection on two servers is not installed), Healthy Services shows 94% (47 out of 50 healthy).
The Healthy Services percentage feeds directly into your Protection Score. The higher the percentage, thehigher your score.
Note: For Armor Enterprise Cloud, only powered-on virtual machines are counted. For Armor Anywhere, only machines that have sent a heartbeat within the last 4 hours are included. Decommissioned or offline servers that are no longer in use should be removed from your account to prevent them from lowering your percentage.
Nexus - Healthy Services
4. Understanding Your Scores
The Health Overview dashboard displays four scores that summarize the security posture of your environment. Each score is on a 0 to 10 scale, where 10 is the best. Scores are calculated and updated nightly at 2:00 AM UTC.
Overall Score
Your Overall Score is the average of your Protection, Detection, and Response scores, rounded to the nearest whole number.
Overall Score = (Protection + Detection + Response) / 3
For example, if your scores are Protection = 10, Detection = 8, and Response = 6, your Overall Score is (10 + 8 + 6) / 3 = 8.
Protection Score
The Protection Score reflects the percentage of security services across your servers that are active and reporting back to Armor. Armor checks whether each service (such as Malware Protection, FIM, IDS, and Log Collection) is installed, enabled, and communicating.
The higher the percentage of healthy services, the higher your score:
Healthy Services | Score |
|---|---|
99% or higher | 10 |
90-98% | 9 |
80-89% | 8 |
70-79% | 7 |
60-69% | 6 |
50-59% | 5 |
40-49% | 4 |
30-39% | 3 |
20-29% | 2 |
Below 20% | 1 |
To improve your Protection Score:
Confirm all servers are powered on and connected to the network.
Check the Service Health table on this page. If any asset shows “Needs Attention,” click into it to see which service is failing.
Use the Toolbox to schedule a reinstall or restart for any service that shows as offline or not installed.
If you have decommissioned servers that are no longer in use, contact Armor Support to remove them from your account. Inactive servers with failing services will lower your percentage.
Services that remain unhealthy for more than 24 hours will begin to affect your Protection Score.
Detection Score
The Detection Score reflects whether the security tools on your servers are actively sending log and event data to Armor for analysis. The more data sources reporting, the better Armor can monitor your environment for threats.
Armor tracks log data from the following sources:
File Integrity Monitoring (FIM) events
Intrusion Detection (IDS) alerts
Malware scan results
Vulnerability scan data
Operating system logs
Endpoint detection logs (CrowdStrike, Sophos, if configured)
The percentage of expected data sources that are actively reporting is converted to a score using the same scale as the Protection Score (99%+ = 10, 90-98% = 9, and so on).
The Events Analyzed count on this page shows the total number of security events Armor processed for your account over the past 7 days.
To improve your Detection Score:
Verify that all agents on your servers are online. An offline agent means no log data flows from that server.
If you use third-party endpoint tools (CrowdStrike, Sophos), confirm that the integration credentials are still valid. A banner will appear on this page if credentials have expired or failed.
Run a manual vulnerability scan from the Toolbox to confirm scanning is active.
If your event count dropped noticeably, check whether a server went offline or whether a firewall rule is blocking outbound traffic from the Armor agent
Response Score
The Response Score reflects how quickly security incidents are being acknowledged and resolved. It measures the average time from when a security incident is created to when it receives its first response.
Both Armor’s response time and your team’s response time are included in the calculation. If Armor responds to an incident and is waiting for your team to take action (for example, approving a remediation step or providing additional information), that waiting time counts toward the average.
Average Response Time | Score | Status |
|---|---|---|
Within 1 day | 10 | Good |
Within 2 days | 9 | Good |
Within 3 days | 8 | Fair |
Within 4 days | 7 | Fair |
Within 5 days | 6 | Fair |
Within 6 days | 5 | Fair |
Within 7 days | 4 | Fair |
Within 14 days | 3 | Poor |
Within 30 days | 2 | Poor |
Over 30 days | 1 | Poor |
Note: Only tickets classified as Security Incidents are included in this score. Regular support requests do not affect it. When Armor Support reviews a ticket, they may label it as a Security Incident with a severity rating (Low, Medium, High, or Critical).
To improve your Response Score:
Respond promptly to incident notifications from Armor. The faster your team acknowledges and acts on Armor’s recommendations, the better the score.
Review open incidents regularly. If there are incidents waiting on your input, addressing them will immediately improve your response time average.
Configure email notifications for support ticket updates so your team is alerted as soon as Armor responds.
If you see old incidents that are no longer relevant (for example, related to servers that have been decommissioned), contact Armor Support to close them.
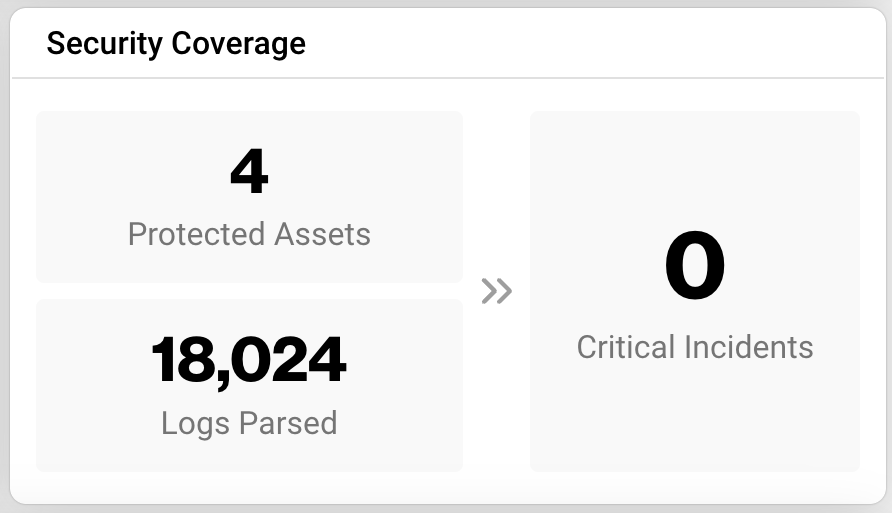
4. Security Coverage
This widget includes three key metrics:
Protected Assets: Assets currently online and monitored by Armor.
Logs Parsed: Number of logs received and analyzed in the past 24 hours.
Critical Incidents: Open or pending support tickets labeled as high-priority security incidents.
Critical Incidents Details:
This widget displays the number of open or pending support tickets that have been classified as Critical Incidents: high-priority, security-focused issues requiring immediate attention.
How Incidents Are Classified
When Armor Support reviews a support ticket, it may be labeled as a Security Incident.
Each incident is assigned a severity rating: Low, Medium, High, or Critical.
Incidents marked as Critical are shown in this widget and are also listed in the Security Incidents screen.
Nexus - Security Coverage
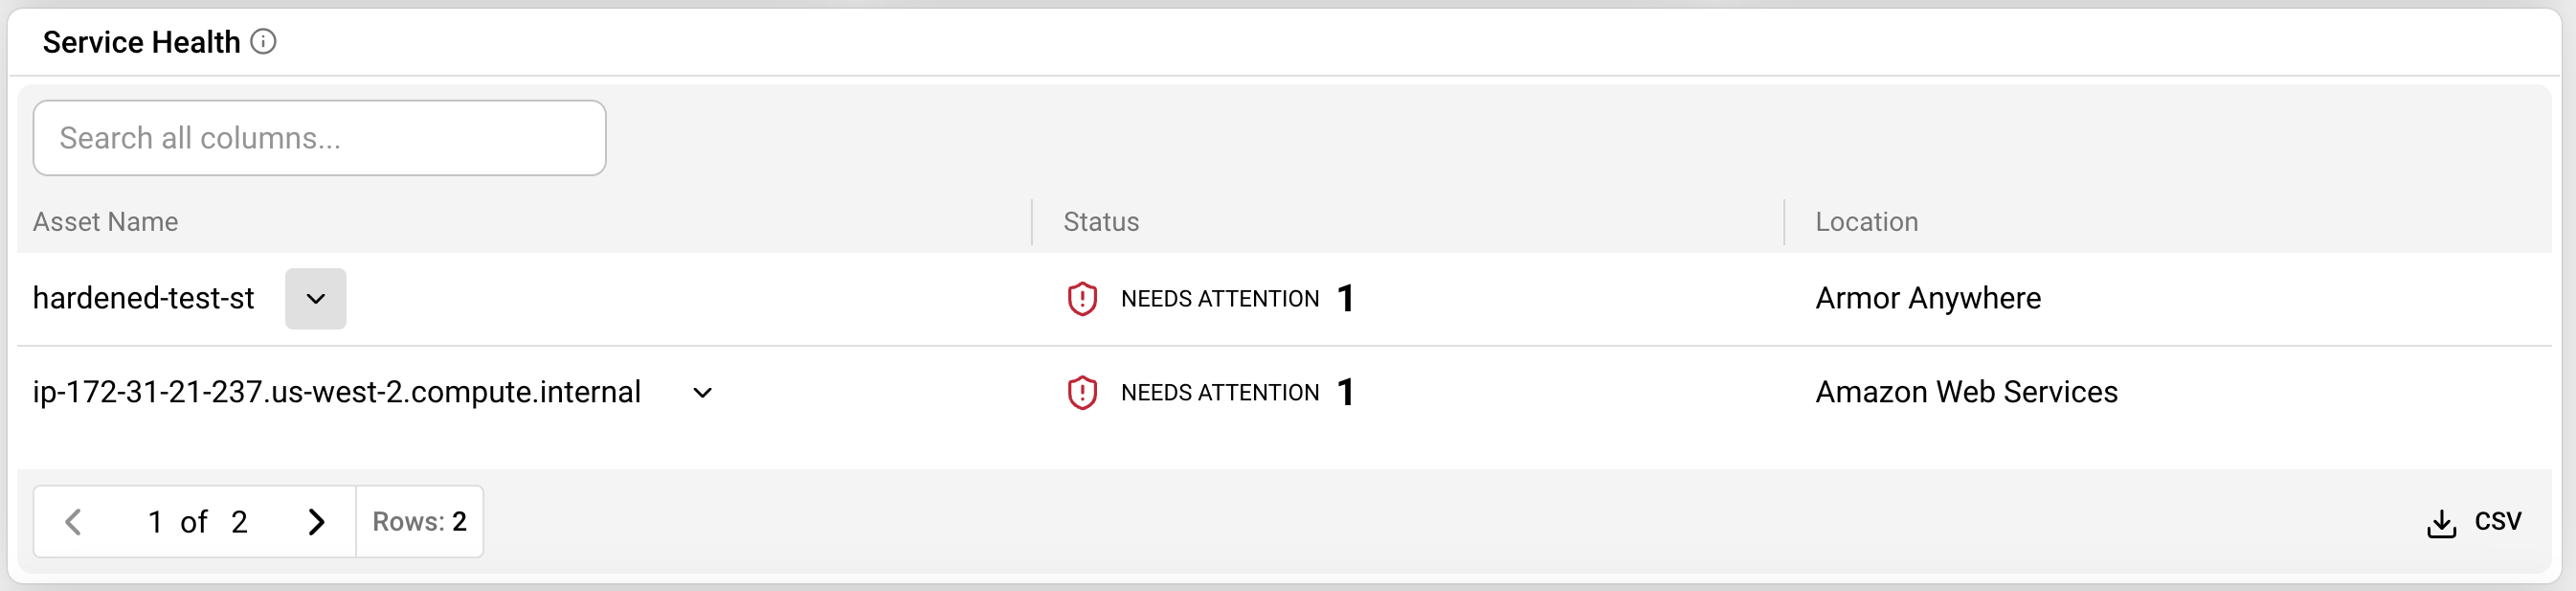
5. Service Health Table
This table highlights the health status of individual assets. Unhealthy services older than 24 hours may negatively impact the Protection Score. It includes:
Column | Description |
|---|---|
Asset Name | Name of the VM or instance. Click to view details. |
Status | Security status:
|
Location |
|
Nexus - Service Health
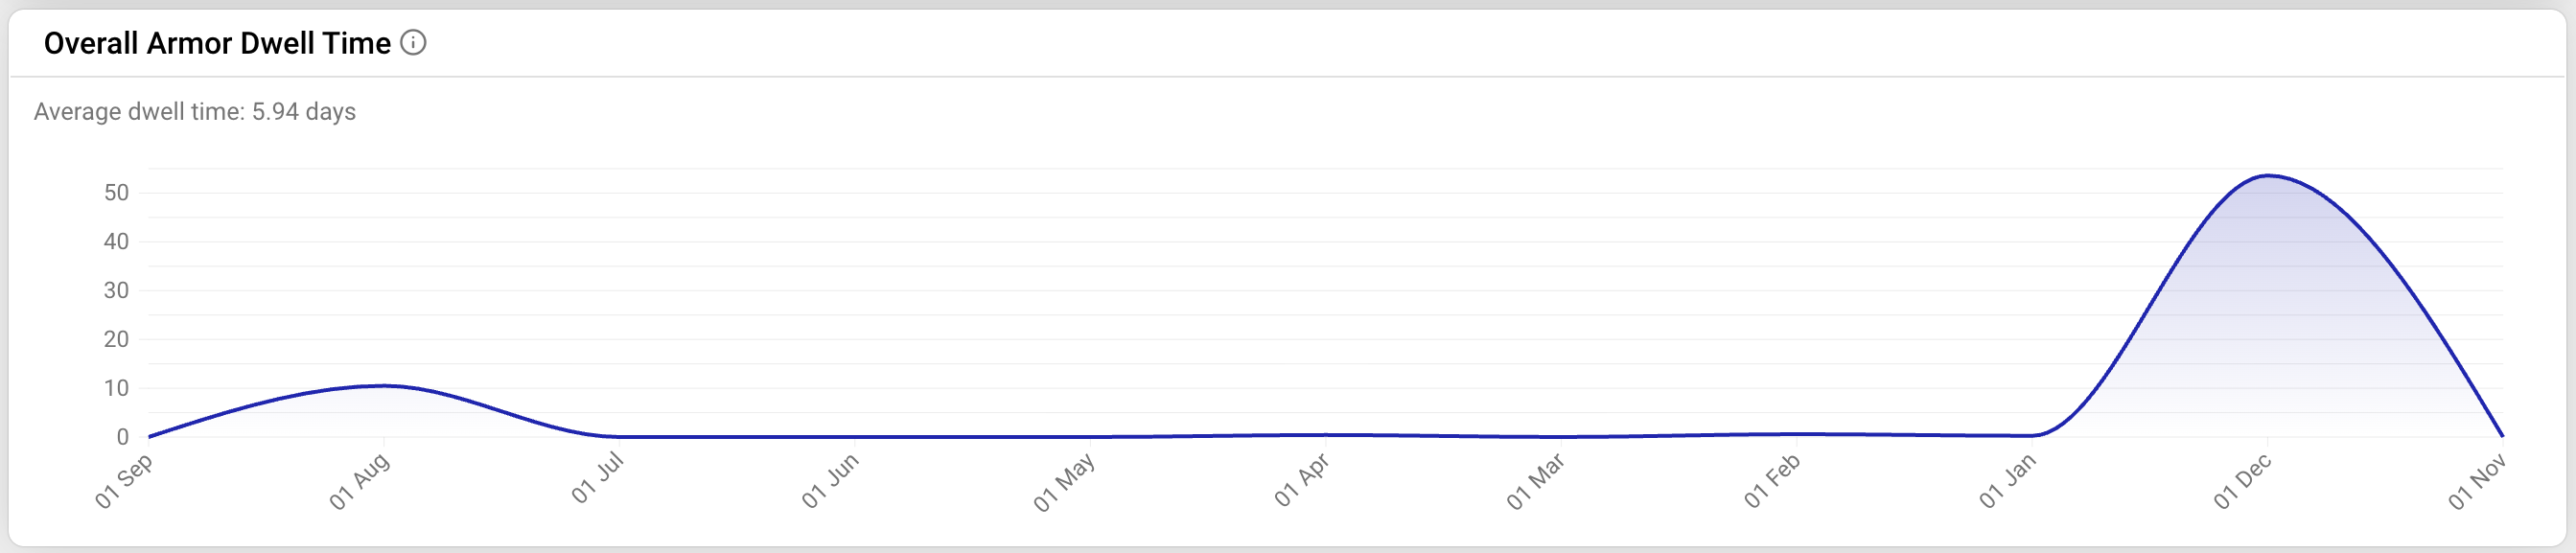
6. Overall Armor Dwell Time
This graph shows the average time Armor takes to resolve a Security Incident, aggregated across all users.
Updated monthly
Not specific to your account
Nexus - Overall Armor Dwell Time
Nexus Overview Dashboard
To fully use this screen, you must add the following permission to your account:
Read Dashboard Statistics
You can use the Health Overview screen to see the overall health status of virtual machines that contain the installed Armor Anywhere agent.
If you are a new user, then you may need to install the Armor Anywhere agent in order to receive data to populate this screen.
To learn how to install the agent, see Installation.
The top of the Health Overview screen contains four types of information, displayed in various widgets.
Widget | Description | |
|---|---|---|
Overall Health Score | This widget displays an average of the Protection, Detection, and Response scores. Scores in the security dashboards are calculated and updated every night at 2:00 AM UTC. Protection This score is based on the stability of the Armor agent and any corresponding subagents. For more information, see Protection Dashboard. Detection This score is based on the incoming activity (log activity) of the Armor agent and any corresponding subagents. For more information, see Detection Dashboard. Response This score is based on the response time for a support ticket between you and Armor. For more information, see Response Dashboard.  | |
Vulnerabilities | This widget displays the number of detected vulnerabilities, based on the information from the weekly vulnerabilities report. The number of detected vulnerabilities displayed in the widget may differ from the detected vulnerability count that displays in the latest scan report. This is because the widget does not include informational alerts (Severity = Info), while the scan report does include these types of alerts. A vulnerability scan takes place every Sunday at 10:00 PM, local server time. After a scan is complete, the corresponding report is added to the Vulnerability Scanning screen of the Nexus. Additionally, this widget is updated based on the scan. To learn about the Vulnerability Scanning screen, see Vulnerability Scanning. | |
Security Incidents Total | This widget displays the number of open or pending support tickets that are considered highly important, security-focused incidents, known as Critical Incidents. Internally, when Armor Support reviews a support ticket, a support personnel can label the ticket as a Security Incident. These tickets will be given a severity rating (low, medium, high, critical), and then displayed in the Security Incidents screen. A Security Incident with a Critical status is also known as a Critical Incident. In the Security Incidents screen, you will only see an incident if you are listed as a recipient on the support ticket or if you opened the support ticket. Armor Support, you, or someone on your account can open a support ticket that can eventually evolve into an incident. To learn more about the Security Incidents screen, see Incidents. Under Security Alerts Needing Attention, you can click a specific incident, and then you will be redirected to the Security Incident screen with the table already filtered. | |
Logs Parsed (Past 24h) | This widget displays the number of logs that Armor has received and analyzed in the past 24 hours. |