Virtual Machines for Armor Agent for Servers
Topics Discussed
To fully use this screen, you must have the following permissions assigned to your account:
Write Virtual Machines
View Core License
Read Utilization
After you sync your public cloud account with the Nexus Portal, you can use the Virtual Machines screen to view the instances associated with your public cloud account.
Additionally, the Virtual Machines screen will display the security status of these instances. All instances for the synced public cloud account will be displayed; however, instances without the Anywhere agent will be labeled as Unprotected.
To sync your public cloud account with Nexus, see Cloud Connections.
The Cloud Connection screen simply lists the synced public cloud account; the Virtual Machines screen lists all the instances listed in that public cloud account.
To learn how to install Armor Anywhere, see Install Armor Anywhere.
Review Virtual Machines
The Virtual Machines screen provides a high-level view of all of your virtual machines.
In Nexus Portal, in the left-side navigation, click Infrastructure.
Click Virtual Machines.
Search by Virtual Machine, Primary IP, or Tag.
Filter by Type, State, or Power Status.
Field | Description |
|---|---|
Name | This column displays the name of the instance from your public cloud account. |
Primary IP | This column displays the the primary IP address associated with the instance. |
Type | This column display the type of instance, specific to the offerings offered by your public cloud provider, such as EC2 instance for AWS.
|
Date Created | This column displays the date the instance was created in your public cloud account. |
Security Groups | This column displays the corresponding security group from your public cloud account. |
State | This column displays the security status of the instance, in relation to the installed agent. There are three states:
|
Power | This column displays the power status of the virtual machine:
|
Tags | This column displays any tags that have been added to the virtual machine on the Tags + Notes screen. |
Review Details for a Specific Virtual Machine
From the Virtual Machines screen, you can access detailed information for each virtual machine.
In Nexus, in the left-side navigation, click Infrastructure.
Click Virtual Machines.
Locate and select the desired instance.
Overview
This section displays detailed information for the virtual machine.
COLUMN | DESCRIPTION |
|---|---|
Type | This entry displays the type of instance, specific to the offerings offered by your public cloud provider, such as EC2 instance for AWS.
|
Provider | This entry displays the public cloud provider for the instance. |
Instance ID | This entry displays the ID associated with the instance or virtual machine. |
Instance State | This entry displays the security status of the instance or virtual machine. |
Original OS Version | This entry displays the original operating system for the instance or virtual machine. |
Current OS Version | This entry displays the current operating system for the instance or virtual machine. |
Public IP | This entry displays the public IP address associated with the instance or virtual machine. |
Agent ID | This entry displays the unique ID associated with the Armor Agent. |
Agent Version | This entry displays the version of the Armor Agent. |
Last Heartbeat | This entry displays the date and time of the last successful heartbeat. |
Sub-Agent Health Table
This section displays the sub-agent health related to your Armor-protected virtual machines.
COLUMN | DESCRIPTION |
|---|---|
Name | This entry displays the specific service that is being checked. |
Product | This column displays the product name associated with the sub-agent. |
Sub-Agent Version | This column displays the sub-agent version. |
State | This entry displays the status of the service, either OK, Needs Attention, or Pending.
|
Message | If the status is Needs Attention, then this entry will display additional details on the service check results. |
Review Sub-Agent Health Details for a Virtual Machine
For each of your virtual machines, you can view sub-agent health details. You can use this information to troubleshoot agents that may be in a bad state.
In Nexus, in the left-side navigation, click Infrastructure.
Click Virtual Machines.
Locate and select the desired instance.
Locate and hover over the sub-agent that you want to view.
Click the name of the desired sub-agent. Or, click the vertical ellipses, then click View Details.
On the left-side of the screen, select the sub-agent that you want to view.
The information that displays on the right-side of the screen will change based on the sub-agent that is selected.
Armor Agent
Review specific information and troubleshooting steps for the Armor Agent service.
SECTION | DESCRIPTION |
|---|---|
Details | This section displays the following information for the Armor agent: Heartbeat
Agent Version
|
File Logging
Review specific information and troubleshooting steps for the File Logging service.
SECTION | DESCRIPTION |
|---|---|
Details | Logs
Log Version
|
Connectivity | This section displays the script to check connectivity, along with steps to remediate. |
File Integrity Monitoring
Review specific information and troubleshooting steps for the File Integrity Monitoring (FIM) service.
SECTION | DESCRIPTION |
|---|---|
Trend to Armor Sync | Trend
Armor
Steps to Remediate |
Connectivity | This section displays the script(s) to check connectivity, along with steps to remediate. |
Errors | This section displays any known errors, along with steps to remediate. |
Intrusion Detection System
Review specific information and troubleshooting steps for the Intrusion Detection System (IDS) service.
SECTION | DESCRIPTION |
|---|---|
Trend to Armor Sync | Trend
Armor
Steps to Remediate |
Connectivity | This section displays the script(s) to check connectivity, along with steps to remediate. |
Errors | This section displays any known errors, along with steps to remediate. |
Malware Protection
Review specific information and troubleshooting steps for the Malware Protection service.
SECTION | DESCRIPTION |
|---|---|
Trend to Armor Sync | Trend
Armor
Steps to Remediate |
Connectivity | This section displays the script(s) to check connectivity, along with steps to remediate. |
Errors | This section displays any known errors, along with steps to remediate. |
Vulnerability Scanning
Review specific information and troubleshooting steps for the Vulnerability Scanning service.
SECTION | DESCRIPTION |
|---|---|
Registered | This section displays the following information for the Armor agent that is registered:
|
Scan Import | This section displays the following scan import information for the Armor agent:
|
Connectivity | This section displays the script(s) to check connectivity, along with steps to remediate. |
Last Scan Time | This section displays the following information regarding the most recent scan:
|
Add Tags and Notes to a Virtual Machine
You can use the Tags + Notes section to add tags to your instance, to improve categorization and search capabilities. You can also add notes to help track changes and tasks related to an instance.
In Nexus, in the left-side navigation, click Infrastructure.
Click Virtual Machines.
Locate and select the desired virtual machine.
Click Tags + Notes.
In the Tags section, enter the desired tag, then click the ( + ) symbol to add.
Multiple tags may be added.
In the Notes section, enter the desired note.
Click Save Changes.
Remove Tags and Notes from a Virtual Machine
In Nexus, in the left-side navigation, click Infrastructure.
Click Virtual Machines.
Locate and select the desired virtual machine.
Click Tags + Notes.
In the Tags section, click the "X" next to the tag that you want to remove.
In the Notes section, delete or edit the note.
Click Save Changes.
Enable Auto-Removal of Inactive Virtual Machines
The auto-remove feature allows you to remove your virtual machines from Nexus that are no longer communicating with Armor.
This feature does not remove your virtual machines from your cloud provider.
This setting is limited to users in the Admin role only.
In Nexus, in the left-side navigation, click Infrastructure.
Click Virtual Machines.
Hover over the plus ( + ) icon, and then click the Virtual Machine Settings icon.
Click the Auto remove VMs setting to enable the auto-remove feature.
Click the setting again to disable the feature.
In Remove VMs after, select the desired time frame for when your virtual machines should be removed - 7 Days, 14 Days, or 30 Days.
Click Save.
Export Usage Data
In Nexus, in the left-side navigation, click Infrastructure.
Click Virtual Machines.
Click Export Usage.
In the drop-down menu, select a file type to download.
Select the range of data to download.
Click Export Usage.
A file will download to your local machine.
OPTION | DESCRIPTION | ||||||||||||||
|---|---|---|---|---|---|---|---|---|---|---|---|---|---|---|---|
All Usage + Summaries - 1 month max | This option will download a .zip file every available file type:
| ||||||||||||||
Usage Details - 1 month max | This option downloads a .zip file with the following information:
| ||||||||||||||
Summary Usage by Host - 6 months max | This option exports the following information:
| ||||||||||||||
Summary Usage by Hour - 6 months max | This option exports the following information:
|
View CLI Results
Users running commands using either Command Line Interface (CLI) or the Armor Toolbox can review the results of commands invoked on a given machine using the CLI Results tab.
In the Nexus, in the left-side navigation, click Infrastructure.
Click Virtual Machines.
Click the desired Virtual Machine name.
Click CLI Results.
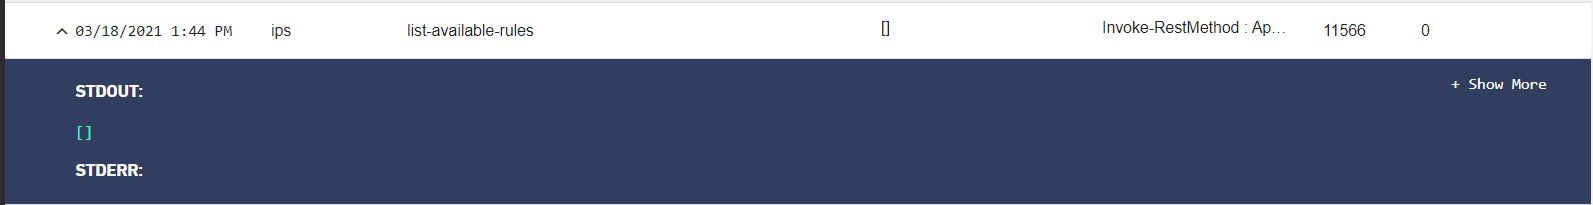
The CLI Results table provides information on commands run on a VM.
COLUMN NAME | DESCRIPTION |
|---|---|
Time Stamp | Date and time of when the command was invoked |
Product Name | Name of the Armor feature or subagent for which the command was invoked |
Product Operation | The operation invoked by the command |
Configuration | Designation of the configuration determined by the command |
STDOUT | Output of the command |
STDERR | Error output of the command |
Duration | Runtime duration measured in milliseconds |
Result Code | Indicates if the command execution was successful
If an error code is returned, please contact support. |
Clicking the Expand icon next to the Time Stamp of a result will display the output stream, which can be collapsed or expanded using the + Show More and - Show Less toggle on the far right of the stream window.
CLI Error Codes
ERROR CODE | EVENTS | DESCRIPTION | CUSTOMER FIX |
|---|---|---|---|
-1 | Script timed out | Script timed out | Contact support. |
201 | Download Failed | Unable to download files this may cause due to invalid download path | Check firewall ports. Ensure running as admin. |
202 | Path Not Found/Error in locating file | File is not avaliable in the given location | Check firewall ports. Ensure running as admin. Check disk space and permissions to temp directories. |
203 | API Error/Unable to complete operation | Error occurs while calling or getting result from API | Check firewall ports. Ensure correct command was executed. |
204 | Installation Failed | Installation of software failed | Ensure running as admin. Check disk space. Check directory permissions. |
205 | Uninstallation Failed | UnInstallation of software failed | Ensure running as admin. Check directory permissions. |
206 | Error while uploading to S3 bucket | Error while uploading files to S3 bucket | Contact Support |
207 | Service Failed to Start | Failed to start subagent's services on VM | Ensure service exists. Ensure install command worked correctly. |
208 | Invalid operation configuration | Invalid opertation added in command | Use valid operation in command check |
209 | Timeout waiting for trend service to start | Timeout waiting for trend service to start while done clone | Run "trend clone" command |
210 | Unable to unlink Malware Protection Support | Unable to unlink Malware Protection Support while clone | Run "trend clone" command |
211 | Unable to register Malware Protection Support | Unable to register Malware Protection Support while clone | Run "trend clone" command |
212 | Subagent is not available | Subagent is not available on the box | Execute appropriate command to install subagent |
213 | Invalid installation package | Invalid installation package downloaded on the box | Check firewall ports. Ensure there isn't a WAF blocking the download.] |
214 | You are not running as an Administrator | command requires admin privilege | Run as Administrator |
215 | Failed to get HOST_ID | HostId was not available in the box | Wait some time. We will eventually pick up the HOST_ID via backend jobs. |
216 | Checksums do not match | Checksums do not match | Check firewall ports. Ensure there isn't a WAF blocking the download. |
217 | Enable of file beat module and component Failed | Enabling of file beat module and its component Failed | Ensure you're running the latest version. Reinstall logging if needed. |
218 | Disable of file beat module and component Failed | Disable of file beat module and its component Failed | Ensure you're running the latest version. Reinstall logging if needed. |
219 | Error in creating directory | Error in creating folders lib,etc,log | Check permissions. Ensure running as admin. |
220 | Extract Failed | Extraction file from any extractable file failed example tar.gz file | Check powershell version on windows. Ensure unzip exists for windows. |
221 | Invalid uninstall code | The command expect valid Uninstall code | Contact Support |
222 | Invalid Config | The config file received is invalid | Contact Support |
223 | Service Restart Failed | Failed to restart Subagent's services | Check service exists. Start manually and check for errors |
224 | Service Stop Failed | Failed to stop subagent's services | Check service exists. Start manually and check for errors |
225 | Logging module commands are not supported | Logging module commands are not supported | Ensure you're running the latest version. Reinstall logging if needed. |
226 | The config value was not retrieved | Expected config for logging module not received from api | Run "logging sync-config" |
227 | Unable to backup the current filebeat config | Unable to backup the current filebeat config | Run "logging sync-config" |
228 | Unable to update the current filebeat config | Unable to update the current filebeat config | Run "logging sync-config" |
229 | Error occurred in retrieving the panopta manifest | Error occurred in retrieving the panopta manifest from api | Contact Support |
230 | openssl is not installed | openssl is not installed. We need openssl to check TLS connectivity | Install openssl and Re-Run tls-check command |
View Vulnerabilities
Users wanting to assess vulnerabilities on an asset can do so through the Vulnerabilities tab in the Asset detail screen within the Virtual Machines section the portal.
In the Nexus, in the left-side navigation, click Infrastructure.
Click Virtual Machines.
Click the desired Virtual Machine name.
Click Vulnerabilities.
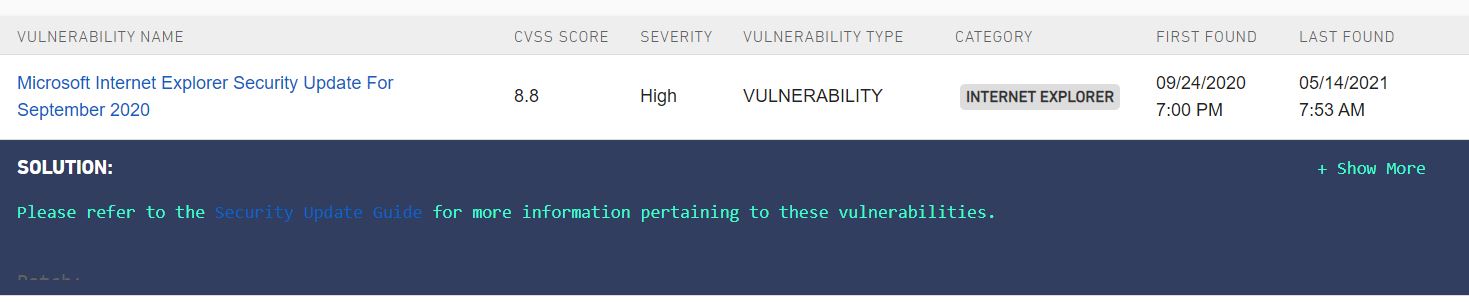
The Vulnerabilities table provides information on vulnerabilities detected on a VM.
Column Name | Description |
|---|---|
Vulnerability Name | Name of the vulnerability detected
|
CVSS Score | This columns displays the Common Vulnerability Scoring System (CVSS) score assigned to the vulnerability. The breakdown of CVSS Scores aligns with the Severity types. |
Severity | This column displays the severity level of the vulnerability. There are four severity types, based on the vulnerability's CVSS:
|
Vulnerability Type | Designation of the vulnerability |
Category | The category of the vulnerability |
First Found | Time stamp of the first detection of the vulnerability |
Last Found | time stamp of the last detection of the vulnerability |
In some instances, a solution is provided below the vulnerability. For example, vulnerabilities from the Internet Explorer category will provide a link to Microsoft's Security Update Guide. Clicking the name of the vulnerability will take the user to the Vulnerability detail screen in Nexus